Difference between revisions of "PAA Sage"
| Line 106: | Line 106: | ||
| || || Mn || CS-137 || Se out at 400, Cs in at 430 | | || || Mn || CS-137 || Se out at 400, Cs in at 430 | ||
|- | |- | ||
| − | | || || Mn || Sage Ash || Se out at | + | | || || Mn || Sage Ash || Cs out at 500, Ash in at 530 |
| + | |- | ||
| + | | || || || Cs || Ash out at 930, Cs in at 950 | ||
| + | |- | ||
| + | | || || || Se || Cs out at 1000 , Se in at 1040 | ||
| + | |- | ||
| + | | || || || Cs || Se out at 1440 , Cs in at 1460 | ||
| + | |- | ||
| + | | || || ||Ni || Cs out at 1500 , Ni in at 1550 (5% deadtime during measurement) | ||
| + | |- | ||
| + | | || || || Cs || Ni out at 1650 , Cs in at 1675 | ||
| + | |- | ||
| + | | || || ||Ash || Cs out at 1700 , Ash in at 1725 | ||
| + | |- | ||
| + | | || || || Cs || Ash out at 2325 , Cs in at | ||
| + | |- | ||
| + | | || || || Se || Cs out at , Se in at | ||
| + | |- | ||
| + | | || || || Cs || Ni out at , Cs in at | ||
| + | |- | ||
| + | | || || ||Ash || Cs out at , Ash in at | ||
|} | |} | ||
Revision as of 18:38, 23 May 2019
PAA_Research PAA on Sage Brush
Motivation
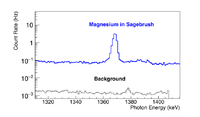
The volatile oil content of sage brush is known to be a strong indicator of both the flammability of sagebrush as well as its forage value for open range livestock<ref name="Sage1968">File:SageBrushMg-vs-VolOil Powell.pdf </ref>. The volatile oils in sagebrush leaves impede the growth of rumen micro-organisms thereby decreasing an animal's appetite. The amount of Magnesium in sagebrush leaves has been shown to be strongly correlated with the volatile oil content of sagebrush. We studied the potential to use Photon Activation Analysis at the Idaho Accelerator Center as a means to measure the Magnesium content of sagebrush. The figure below illustrates our ability to identify the presence of Magnesium in sagebrush leaves. With further work, this method has the potential to provide ranchers and fire prevention services with a means of monitoring the forage value and fire risk of Idaho's sagebrush population.
Preliminary results
5/23/19
Calibration Detect A
| Source | Energy (keV0 | Channel |
| Th Rod | 238.8 (highest peak) | 548.152 |
| Ba-133 | 276.398 | 632.9 |
| Th Rod | 338.8 (4th highest) | 772.106 |
| Ba-133 | 356 | 811.78 |
| Na-22 | 511 | 1159.92 |
| Th Rod | 583.4 (2nd highest peak) | 1322.244 |
| Cs-137 | 661.7 | 1497.84 |
| Th Rod | 911.2 (3rd highest) | 2059.4 |
| Na-22 | 1274.5 | 2875.50 |
| Th Rod | 2614.6 | 5886.485 |
MPA Fit: (-5.74857) + (0.445818)*x + (-2.04348e-7)*x^2
Calibration Detect D
| Source | Energy (keV | Channel |
| Th Rod | 238.8 (highest peak) | 531.303 |
| Ba-133 | 276.398 | 615.556 |
| Th Rod | 338.8 (4th highest) | 253.581 |
| Ba-133 | 356 | 792.917 |
| Na-22 | 511 | 1138.136 |
| Th Rod | 583.4 (2nd highest peak) | 1298.982 |
| Cs-137 | 661.7 | 1473.827 |
| Th Rod | 911.2 (3rd highest) | 2029.758 |
| Na-22 | 1274.5 | 2839.048 |
| Th Rod | 2614.6 | 5824.23 |
MPA Fit: (0.0122021) + (0.449001)*x + (-3.08126e-8)*x^2
Run list
data/Dan-May 2019 Gallium run
thorium002.mpa: Thorium on A & D
cs-127-003.mpa: Thorium on A & Cs on D
Na-22-004.mpa: Thorium on A and Na-22
Ba-133-005.mpa: Thorium on A & Ba-133 on D
run list
30 MeV electrons at 120 Hz rep rate with 0.12 A and 2.1 microsec width
Irradiation began at 7:44 am Irradiation ended at 10:15 am
at 11:59 am beam off time was 1 hr 44 min
| run # | Filename | Sample in Det A | Sample In Det D | Time since Beam Off |
| 6 | SeInDMnInA_006.mpa | Mn | Se | 1hr 52 min 20 sec |
| Mn | CS-137 | Se out at 400, Cs in at 430 | ||
| Mn | Sage Ash | Cs out at 500, Ash in at 530 | ||
| Cs | Ash out at 930, Cs in at 950 | |||
| Se | Cs out at 1000 , Se in at 1040 | |||
| Cs | Se out at 1440 , Cs in at 1460 | |||
| Ni | Cs out at 1500 , Ni in at 1550 (5% deadtime during measurement) | |||
| Cs | Ni out at 1650 , Cs in at 1675 | |||
| Ash | Cs out at 1700 , Ash in at 1725 | |||
| Cs | Ash out at 2325 , Cs in at | |||
| Se | Cs out at , Se in at | |||
| Cs | Ni out at , Cs in at | |||
| Ash | Cs out at , Ash in at |
<references/>

