Difference between revisions of "PAA CoincidenceCounting"
| Line 136: | Line 136: | ||
Run 5480, Na-22 source, attenuation is 3 db, 0.5 Mev photon peaks are around 1500 channels in ADC spectrum | Run 5480, Na-22 source, attenuation is 3 db, 0.5 Mev photon peaks are around 1500 channels in ADC spectrum | ||
| − | + | =Singles SPectrum 3rd attempt (Peak sensing ADC)= | |
| + | |||
| + | |||
| + | Using the CAEN 785 peak sensing ADC I was able to increase the dynamic range and take positive going pulses. | ||
| + | |||
| + | Below are the first two spectra with sourses and almost no discrimination | ||
= Coincidence Tests= | = Coincidence Tests= | ||
Revision as of 23:02, 5 August 2013
ADC non-linearity
Canberra Model 9615 < 0.04% (integral) over 2usec
Canberra Model 9633 < 0.025% (integral) < 0.9% (differential), +10V range into 1kOhm, 8192 channels, 100 usec signal width => 100 pC/chan
CAEN V792 < 0.1% (integral), 200 fC/chan
CAEN digitizer VX1492, 14 bit, 10 Volt range
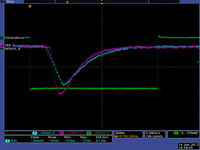
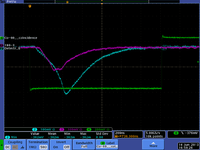
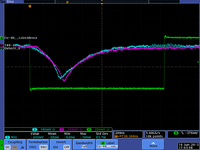
Coinc Scope pictures
First pict with ADC gate
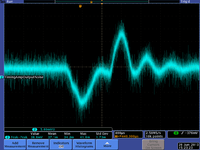
Two HpGe detectors were used to detect coincidence gammas from Co-60 on 6/14/2013.
Co-60 will beta decay to Ni-60 giving off two gammas in coincidence having energies of 1173 and 1332.5 keV. The scope pictures below record the pulses from the HpGe detector that are in coincidence. I would have expected the charge output by the HpGe detector to be similar for the two gammas, but there are some that have less than half the charge. The could be the beta particles from the decay reaching one of the detectors in coincidence with one of the gammas.
First Singles Spectrum
Detector B
Detector 180-3
50 keV Energy resolution from an HpGe detector??
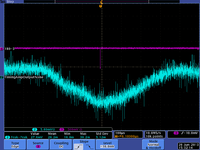
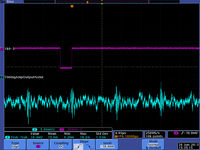
I think the inverting amp is too noisy:
The Signal is about 400 mV and the above noise is 37 mV peak-to-peak and it is syncronized with my integrate gate
The voltage variations of the timing amp output in the region of the integrate gate are about +/- 10 mV
Singles Spectrum (2nd attempt)
Using detector 180-3
HV = -2800 Volts
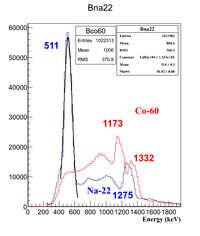
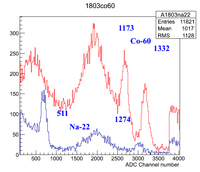
Run 5446, Co-60 and Na-22 sources are in at the same time, attenuation is 18 db, 1 Mev photon peaks are around 3000 -> 3500 channels in ADC spectrum
Two Co-60 Lines
Mean 2.94555e+03 +/- 7.23197e-01 Sigma 7.61455e+01 +/- 8.86697e-01
Mean 3.63275e+03 +/- 8.39279e-01 Sigma 7.45542e+01 +/- 1.04796e+00
1.2 meV na-22 line
Mean 3.37891e+03 +/- 1.07859e+00 Sigma 6.26450e+01 +/- 1.73063e+00
Run 5447, Na-22 source, attenuation is 18 db, 1 Mev photon peaks are around 3000 -> 3500 channels in ADC spectrum Mean 3.38431e+03 +/- 1.29456e-01 Sigma 1.12914e-01 +/- 2.59220e-02
Run 5448, Na-22 source, attenuation is 14 db, 0.511 Mev photon peaks are around 1000 channels in ADC spectrum
Run 5449, Na-22 source, attenuation is 12 db, 0.511 Mev photon peaks are around 2500 channels in ADC spectrum
Mean 2.60181e+03 +/- 8.10190e-01 Sigma 5.97964e+01 +/- 6.63405e-01
Run 5450, Co-60 source, attenuation is 12 db, 1 Mev photon peaks are around 3000-> overflow channels in ADC spectrum
Run 5451, Co-60 source, attenuation is 13 db, 1 Mev photon peaks are around 2500 -> 3500 channels in ADC spectrum
Low energy 1.2 MeV peak
Mean 2.64173e+03 +/- 1.35816e+00 Sigma 1.03518e+02 +/- 1.49690e+00
High energy 1.3 MeV peak Mean 3.33157e+03 +/- 1.36696e+00 Sigma 1.01444e+02 +/- 1.15611e+00
Run 5452, Na-22 source, attenuation is 13 db, 1 Mev photon peaks are around 2500 -> 3500 channels in ADC spectrum
Mean 3.02266e+03 +/- 1.53757e+00 Sigma 5.26142e+01 +/- 1.61646e+00
Run 5453, NO source, attenuation is 13 db, 1 Mev photon peaks are around 2500 -> 3500 channels in ADC spectrum, run started at 17:18:27 on July 23 ended on July 24 at 15:34:05
Run 5484, Na-22 and Co-60 source, attenuation is 14 db, 1 Mev photon peaks are around 2600 -> 3600 channels in ADC spectrum, Na-22 and Co-60 peaks are separable unlike in detector B
Run 5484, Na-22 source, attenuation is 8 db, 0.5 Mev photon peaks are around 2000 channels in ADC spectrum
Using detector B
HV = +4520 Volts
Run 5466, Na-22 source, attenuation is 17 db, 1 Mev photon peaks are around 2300 channels in ADC spectrum
Run 5470, Co-60 source, attenuation is 17 db, 1 Mev photon peaks are around 2300 channels in ADC spectrum
Run 5471 & 5472, Na-22 and Co-60 sources both in, attenuation is 17 db, 1 Mev photon peaks are around 2300 channels in ADC spectrum
Run 5474, Na-22 source, attenuation is 12 db, 0.5 Mev photon peaks are around 1000 channels in ADC spectrum
- The above runs used the same input lines that were used for detector 180-3, Now I put Detector B through its own signal lines and the attenuation needed changes
Run 5477, Na-22 source, attenuation is 9 db, 1 Mev photon peaks are around 3000 channels in ADC spectrum
Run 5478, Co-60 source, attenuation is 9 db, 1 Mev photon peaks are around 3000 channels in ADC spectrum
Run 5480, Na-22 source, attenuation is 3 db, 0.5 Mev photon peaks are around 1500 channels in ADC spectrum
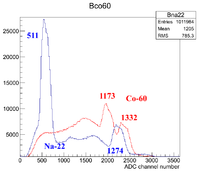
Singles SPectrum 3rd attempt (Peak sensing ADC)
Using the CAEN 785 peak sensing ADC I was able to increase the dynamic range and take positive going pulses.
Below are the first two spectra with sourses and almost no discrimination
Coincidence Tests
Detector B is in ADC Ch4
Detector 180-3 is in ADC CH8
Proposed Apparatus
We propose to acquire two 14 bit digitizers (flash ADCs), a muli-hit time-to-digital converter, and the associated NIM electronics needed to supplement our current VME based data acquisition system. The availability of precision analog digitizers and pipeline time to digital converters allows the construction of a data acquisition system to record the pulse shape and time information that will allow the reconstruction of individual coincidence events. The most common method used to record photon spectroscopy information does so by accumulating events thereby loosing any temporal information. We propose a coincidence counting system which records the wave form of each coincidence event along with a time stamp. The system will allow a post data taking analysis that can increase the coincidence time constraint beyond the original requirement and ascertain the degree of confidence in identifying the decay under consideration.
Isotopes for CPAA
Au
neutron knockout
Knock a neutron out of natural gold such that an excited state of Au-196 remains that will undergo electron capture to Pt-196 with a half life of 6 days or 2% of the time it can be left in a meta stable state with two possible half lifes of 8 seconds or 9 hours.
Au-196 Meta state
The 8 sec metastable state of Au-196 decays through the emission of only one 84.66 keV photon.
The 9.6 hour metastable state has high intensity gamma lines at 147.81 keV and 188.27 keV.
Pt-196 decay EC decay
with a half life of 6 days.
The Pt-196 has a 355.73 dominant (100% relative intensity) gamma line that goes to the 256.2 state giving off a 97.3 keV photon
proton knockout
