Difference between revisions of "Neutron TGEM Detector Abdel"
| Line 27: | Line 27: | ||
[[File: TDC_GEM.png | 300 px]] | [[File: TDC_GEM.png | 300 px]] | ||
| + | ;QDC shows a difference | ||
| + | |||
| + | [[File: QDC_source_on_off_7724_7726.png | 300 px]] | ||
=Measurements of the frequently used gas mixture 90/10 Ar/CO2 for the second peak = | =Measurements of the frequently used gas mixture 90/10 Ar/CO2 for the second peak = | ||
Revision as of 14:49, 16 September 2014
QDC TDC PS-ADC setup
- Peak sensing gate

- QDC gate

- TDC start

- TDC STOP

- QDC shows a difference

Measurements of the frequently used gas mixture 90/10 Ar/CO2 for the second peak
- Changes from the former set up
- Using the eG&G timing filter amp. 474 instead of the spectroscopic amp. to amplify the input for the peak sensing ADC.
- Gate of a width of 4us has been delyed to track the second peak, as a result part of output spectrum is lost except for the delayed part within the gate width as shown in the figures below:
- Lost

- Detected


| Run Number | Date | start | end | Time (min) | Shutter | Source | Count rate (counts/min) | Notes |
| 7435 | 08/24/14 | 19:30:48 | 19:55:32 | open | on | 400 | a peak is noticed on channel 400 | |
| 7436 | 08/24/14 | 19:59:05 | 20:40:11 | open | off | 216 | the peak disappeared | |
| 7438 | 08/24/14 | 19:59:05 | 10:00:00 | open | on | 0.0146 | triple coin., high noise, max. is ch 355 | |
| 7444 | 08/25/14 | 21:17:25 | 21:20:35 | open | on | 230 | gate delay 700 ns, peak disappeared 
| |
| 7446 | 08/25/14 | 21:29:51 | 21:38:55 | open | off | 185 | does not count for P_B. peak disappeared |

unknown gas mixed bottle measurements
- Updates
Changing the leading edge disc. to understand the Peak sensing and explain the cut int he peak sensing graph.
Measuring the noise. by starting by low signal rate to distinguish the signal from the noise.
- Channels and signals
| device | ch | input source |
| ADC | 5 | GEM's trigout |
| Peak sensing 7 | 15 | GEM's trigout |
| Peak sensing 5 | 11 | PMT Left |
| Peak sensing 8 | 17 | PMT right |
| PS translator | ||
| TDC | 25 | PMT L |
| TDC | 27 | GEM's trigout |
| TDC | 29 | PMT R |
| TDC | 31 (Stopper) | triple coincidence (OR Mode) |
| CAEN N638 | ||
| TDC | 17 | PMT L |
| TDC B2 | 18 | GEM's trigout multi-hit |
| TDC B6 | 22 | GEM's B_p |
| TDC | 21 | PMT R |
| TDC 6 | 30 (pulser) | triple coincidence (OR Mode) |
| TDC 7 | 23 | delayed GEM's trigout |
| Run Number | Date | start | end | Time (min) | Shutter | Source | Count rate (counts/min) | Notes |
| 7273 | 08/06/14 | 07:10:38 | 11:41:00 | 12502 | open | off | 67 | 0.1 flow rate |
| 7274 | 08/06/14 | 11:49:35 | 18:15:01 | 23126 | closed | off | 39 | 0.1 flow rate |
| 7275 | 08/06/14 | 20:37:07 | 09:10:10 | closed | off | 40 | 0.2 flow rate | |
| 7276 | 08/06/14 | 09:15:00 | 09:32:00 | open | off | 80 | 0.2 flow rate amplification increases from 50 to 100 | |
| 7277 | 08/06/14 | 09:33:08 | 11:40:42 | 7654 | open | off | 81 | 0.2 |
| 7295 | 08/08/14 | 17:36:58 | 19:55:59 | 4741 | closed | off | 60 | 0.2 |
| 7296 | 08/08/14 | 22:28:01 | 23:43:14 | closed | off | 58 | 0.3 | |
| 7297 | 08/08/14 | 23:48:14 | 12:08:00 | 37186 | open | off | 93 | 0.3 |
| 7298 | 08/09/14 | 00:16:14 | 06:08:03 | 21109 | closed | off | 56 | 0.3 |
| 7299 | 08/10/14 | 19:27:12 | 20:09:04 | 2152 | closed | on | 107 | 0.1 |
| 7300 | 08/10/14 | 20:11:30 | 20:46:29 | 2099 | open | on | 136 | 0.1 |
| 7302 | 08/11/14 | 06:53:14 | 07:22:45 | 1771 | closed | on | 114 | 0.2 |
| 7303 | 08/11/14 | 07:26:58 | 07:48:01 | 1263 | open | on | 167 | 0.2 |
| 7305 | 08/11/14 | 13:21:16 | 13:55:05 | 2029 | open | on | 178 | 0.3 |
| 7306 | 08/11/14 | 14:41:00 | 15:40:00 | 3540 | closed | on | 110 | 0.3 |
| 7307 | 08/14/14 | 08:14:15 | 08:20:39 | 384 | closed | off | 0.1 noise measurements (pulser only) | |
| 7308 | 08/14/14 | 08:22:43 | 08:29:23 | open | off | 1314 | 0.1 noise measurements (pulser only) same noise level as shutter closed (ch. 86) for Peak sensing ADC | |
| 7309 | 08/14/14 | 08:35:09 | 09:45:37 | 4229 | open | off | 0.1 flow rate was not exact, little less. | |
| 7310 | 08/14/14 | 09:46:12 | 11:18:39 | 5547 | open | off | 54 | 0.1 flow rate was not exact, little less. |
| 7311 | 08/14/14 | 11:19:45 | 13:01:57 | 6132 | open | off | 52 | 0.1 flow rate was not exact, little less. |
| 7312 | 08/14/14 | 13:10:50 | 14:28:07 | 4637 | open | off | 72 | 0.1 flow rate was not exact, little less. |
| 7313 | 08/14/14 | 14:30:24 | 15:38: 48 | 4056 | open | off | 80 | 0.1 flow rate as is used to be |
| 7314 | 08/14/14 | 15:41: 52 | 16:46:55 | 3897 | open | on | 147 | 0.1 flow rate as is used to be |
| 7315 | 08/14/14 | 16:49: 59 | 19:14:30 | 8729 | open | on | 148 | 0.1 flow rate as is used to be |
| 7316 | 08/14/14 | 19:18:43 | 22:14:07 | 10596 | open | on | 147 | 0.1 flow rate as is used to be |
| 7317 | 08/14/14 | 22:18:24 | 10:18:52 | 43220 | open | on | 0.0095 | 0.1 flow rate, triple coincidence |
| 7318 | 08/15/14 | 10:24:00 | 12:42:23 | 8303 | open | on | 147 | 0.1 flow rate |
| 7319 | 08/15/14 | 12:46:14 | 15:46:09 | 10795 | open | on | 148 | 0.1 flow rate |
| 7323 | 08/15-16/14 | 16:59:39 | 06:03:11 | 46970 | open | off | 0.0011 | 0.1 flow rate, triple coincidence |
| 7329 | 08/16/14 | 07:06:32 | 10:35:35 | 12543 | open | off | 83 | 0.1 flow rate, PMT's charge is measured for L and R |
| 7330 | 08/16/14 | 10:41:58 | 12:48:33 | 7595 | open | on | 146 | 0.1 flow rate |
| 7331 | 08/16-17/14 | 12:52:07 | 06:45:03 | 64384 | open | off | 0.0016 | 0.1 flow rate, triple coincidence, coda counted 111 but the data file is empty! |
| 7332 | 08/17/14 | 06:52:26 | 07:04:45 | 739 | open | on | 1367 | 0.1 flow rate noise measurements with the wave generator |
| 7333 | 08/17/14 | 07:05:50 | 08:53:54 | open | on | 155 | 0.1 flow rate | |
| 7334 | 08/17/14 | 08:57:02 | 13:13:38 | open | off | 82 | 0.1 flow rate | |
| 7337 | 08/17/14 | 14:17:24 | 14:30:29 | open | on | 1400 | 0.1 flow rate, GEM 2.92 kV , CATH 3.47kV(+50V), noise measurements with the wave generator | |
| 7338 | 08/17/14 | 14:31:37 | 16:17:45 | open | on | 163 | 0.1 flow rate | |
| 7339 | 08/17/14 | 16:20:25 | 16:35:45 | open | off | 1368 | 0.1 flow rate, noise measurements with the wave generator | |
| 7340 | 08/17/14 | 16:37:01 | 20:33:04 | open | off | 95 | 0.1 flow rate | |
| 7341 | 08/17-18/14 | 20:40:16 | 06:18:43 | open | off | 0.0015 | 0.1 flow rate, triple coincidence | |
| 7342 | 08/18/14 | 06:25:44 | 06:37:43 | open | on | 1403 | 0.1 flow rate, noise measurements | |
| 7345 | 08/18/14 | 06:39:23 | 14:17:58 | open | on | 0.0128 | 0.1 flow rate, triple coincidence | |
| 7355 | 08/18/14 | 16:03:29 | 19:59:51 | open | off | 75 | 0.1 flow rate, EM 2.82 kV , CATH 3.37kV(-50V), CAEN translator is used | |
| 7356 | 08/18/14 | 20:03:05 | 20:07:58 | open | on | 2k | 0.1 flow rate, noise measurement | |
| 7357 | 08/18/14 | 20:08:43 | 22:48:22 | open | on | 142 | 0.1 flow rate | |
| 7358 | 08/18-19/14 | 22:53:13 | 10:52:44 | open | on | 0.0082 | 0.1 flow rate , triple coincidence | |
| 7359 | 08/19/14 | 10:55:49 | 10:59:52 | open | on | 2.1k | 0.1 flow rate , noise measurement | |
| 7360 | 08/19/14 | 11:00:38 | 14:26:38 | open | on | 156 | 0.1 flow rate noise measurement with 1 Hz sampling | |
| 7361 | 08/19/14 | 14:40:49 | 18:25:00 | open | on | 0 | 0.1 flow rate with 1 Hz sampling (AND gate) | |
| 7362 | 08/19/14 | 18:33:15 | 18:38:54 | open | on | 1.5k | 0.1 flow rate triple coinc.(OR) | |
| 7363 | 08/19-20/14 | 18:39:46 | 13:39:45 | open | on | 0.0081 | 0.1 flow rate triple coinc.(OR) | |
| 7364 | 08/20/14 | 13:44:56 | 13:50:57 | open | off | 1.55k | 0.1 flow rate noise measurements, 2.87, 3.42kV for GEM and CATH | |
| 7367 | 08/20/14 | 15:08:27 | 16:49:37 | open | off | 86 | 0.1 flow rate, 2.87, 3.42kV for GEM and CATH | |
| 7368 | 08/20/14 | 16:53:42 | 17:15:49 | open | on | 154 | 0.1 flow rate | |
| 7369 | 08/20/14 | 17:17:39 | 20:28:43 | open | off | 86 | 0.1 flow rate, spec. amplifier decreased from 100 to 50 | |
| 7479 | 08/27/14 | 10:02:21 | 10:42:09 | open | on | 64 | 0.1 flow rate, | |
| 7480 | 08/27/14 | 10:46:18 | 14:17:22 | open | off | 11 | 0.1 flow rate, | |
| 7481 | 08/27/14 | 14:19:33 | 14:43:39 | close | on | 78 | 0.1 flow rate, | |
| 7488 | 08/27/14 | 16:16:37 | 16:48:53 | open | on | 86 | 0.1 flow rate, | |
| 7491 | 08/27/14 | 18:09:27 | 18:59:05 | open | on | 86 | 0.1 flow rate, |
Peak sensing measurements by 08/28/14
Peak sensning measurements for GEM were recorded in the time between 8:00 am to 9:44am for shutter open as the following
| Source On | Source Off |
| 7507 | 7506 |
| 7509 | 7508 |
| 7511 | 7510 |
| 7513 | 7512 |
| 7515 | 7514 |
| 7517 | 7516 |
| 7519 | 7518 |
| 7521 | 7520 |


Different output for each run when Peak sensing is used to measure the charge, what is noticed that the charge is different from one run to another, but all the runs show that the amount of charge collected is bigger when the shutter is open with the source on it except for run 7511. By comparing all the runs, As the shutter is open, the maximum charge is collected by channel number 800, as the source is on the detector, the collected charge reached up to channel 1000 at most.
Measuring the data started by 8 am, the noise rate increased so it increased the event rate from 30s to 80s event/s, and it did not decrease until now (Thur. 15:36 08/28/14). all module wiring were checked but without any result. I am using the 90/10 Ar/CO2 bottle as hope to take some measurements but when the noise level goes down maybe this evening to repeat the same measuremnts.
The following reference shows a change in collected charge as the tenperature changes <ref>"Discrimination of nuclear recoils from alpha particles with superheated liquids" F Aubin et al 2008 New J. Phys. 10 103017 </ref>

Flow rate and figures
- 03 flow rate


- 02 flow rate


01 flow rate


Common Start Common Stop exchange
Edit the file
cd /usr/local/coda/2.5/readoutlist/v1495trigPAT/
as the following:
for common start comment:
/* c775CommonStop(TDC_ID);
for common stop uncomment:
c775CommonStop(TDC_ID);
Ionization xsections for different particles emitted from U-233
- Photons


Ref. : http://physics.nist.gov/PhysRefData/Xcom/html/xcom1.html
- Electrons

Ref. :
Data Nucl. Data Tables 54 (1993) 75 File:Electron ionization Ar.pdf
- Alpha Particles

Ref. :
http://www.exphys.jku.at/Kshells/
Data Nucl. Data Tables 54 (1993) 75
Coincidence Measurements for GEM and the Plastic scintillator
- Coincidence Measurement for the scintillator PMT's without shielding and without source
| Date | Time | No. of Counts (counts) | Count rate (counts/min) |
| 07/09/14 | 1066 | 659005 | 618 |
| 07/10/14 | 538 | 368974 | 686 |
- Triple coincidence Measurement for the scintillator PMT's shielded and without source
Triple coincidence among the 2 PMT's and the GEM detector is measured using coincidence module caberra 2144 and ortec 778 counter, count rate is 0.3+_ 0.03 Hz. However, the rate was zero before shielding.
The following pics show The GEM output with triple coincidence signal, it is observed that different GEM peaks coincide with the triple signal, which shows that adding the shielding contaminates the neutron signal.


Coincidence Measurements for the Plastic scintillator after shielding
- Without source
The plastic scintillator count rate before shielding and without source was in average 12 +_ 1 Hz, lead is added to the GEM and to the plastic scintillator which did not change the rate of the coincidence for the plastic scintillator . Neither closing the box door with lead nor adding lead to the top of the box did make any change in the number of counts for the plastic scintillator.
- With a source
Background count rate
| Date | Time | PSD_e (counts) | PSD_e (counts/min) | LED (low disctrinimation)(counts) | LED (low disctrinimation)(counts/min) | LED (high disctrinimation) (counts) | LED (high disctrinimation) (counts/min) |
| 07/01/14 | 1166 | 56671 | 49 | 2936748 | 2519 | 10 | 0.009 |
| 07/01/14 | 231 | 10529 | 572657 | 1542 |
|
data graphs

The above graph represents the change in the count rate of B_p, as the shutter is open (green) and as it is closed (red), the error bars get smaller since each point represents the average of two sets of daily measurements, in addition to, changing the PS discriminator's level after the second measurement.

The above graph has the same legend as the one for B_p, error bars increase for some data when the shutter is open, since one or more of the daily measurements has a higher number of counts because of U-233(4)'s spentaneous fission. (the number of counts is close to the number of counts as the shutter is open and the source is on).
Small=
Testing GEM Experiment test 10/23/13
The GEM detector was tested for signal and discharge as the voltage of the cathode and HV-circuit divider is 3.3 kV and 2.7 kV successively.
The GEM detector signal is observed as it used to work before. the pictures below show the signal detected as the shutter is open and as it is close.
| shutter close | ||||
| shutter open |
THGEM#9 Counting Experiment test 1/4/13
GEM HV-divider circuit
GEM HV-divider circuit in shown in the figure, measurements were recorded for for top and bottom voltage of each preamplifier.

The table below shows value of the voltage on each preamplifier's side relative to ground.
| 2550 | 2579 | 2259 | 304 | 1671 | 1394 | 279 | 818 | 570 | 245 |
| 2600 | 2630 | 2303 | 310 | 1704 | 1421 | 285 | 834 | 581 | 250 |
| 2650 | 2680 | 2348 | 316 | 1737 | 1449 | 290 | 850 | 592 | 255 |
| 2700 | 2731 | 2393 | 322 | 1770 | 1476 | 296 | 866 | 603 | 260 |
| 2750 | 2781 | 2373 | 328 | 1803 | 1503 | 302 | 882 | 614 | 264 |
| 2800 | 2832 | 2482 | 332 | 1836 | 1530 | 307 | 898 | 625 | 269
|
The source voltage means the voltage value on the 4-channel CAEN N470 display. (suppose to be equal to the voltage of the top GEM1).
the values are going to be an input for ANSYS which is going to simulate the electric field for each source voltage separately, ANSYS' output files will be an input for Garfield to simulate the electron multiplication by the triple GEM.
GEM alpha-Beta detector counter
GEM Alpha-Beta detector counter
GEM gain data graphs and GEM Calibration in LDS
GEM Detector
GEM performance QDC data graphs
Electronics Flow Chart

GEM Detector and Scintillator
GEM and Sci. data and measuurements
GEM gain data graphs and GEM Calibration at the IAC
Haitham may only alter the QDC's dual timer and a CFD for the QDC in the IAC DAQ.
Haitham may only add signals to the NIM->ECL translator
Haitham is not allowed to change any cables that are used for the PAA setup
- Summary
The detector is installed in the IAC after modifications took place in the detector design.
These modifications are:
1- The detector kipton window's area increased to the same size of the GEM cards( 10X10 cm)
2- The distance of the cathode from the first GEM increased up to 1.2 cm. previously the distance was about 3.5 mm. (No change in GEM's distances 2.8mm, or the readout 0.5 mm)
Increasing the drift distance demands an increase in cathode potential to maintain the same values of the electric field in the old setup.
3- The detector is installed in a wooden box, in addition to a plastic scintillator which was placed to cover part of the detector window.
Electronics Flow Chart

U-233 fission x-section data


What is the energy distribution of Beta, Photon and alpha from U-233
Alpha
| nuclide | Energy (MeV) |
| Pb-213 | 8.4 |
| Bi-213 | 5.9 |
| At-217 | 6.3 |
| Fr-221 | 6.3 |
| Th-229 | 4.85 (alpha spectrum, highest counts for is 4.85 MeV) |
Gamma
Gamma distribution for U-233 and its daughters are in metioned in details in the documents , File:U233 day gamma.pdf <ref>http://www.radiochemistry.org/periodictable/gamma_spectra , Wed. 04/10/2013</ref>
The energy range of the emitted gamma is shown in the following table .
| nuclide | Energy Minimum | Energy Maximum (keV) |
| U-233 | 25 | 1,119 |
| Ra-225 | 40 | 40 |
| Ac-225 | 10.5 | 758.9 |
| Fr-221 | 96.8 | 410.7 |
| At-217 | 140 | 593.1 |
| Bi-213 | 323.81 | 1,119.4 |
Beta
Beta particles are emitted mainly from U-233 daughters as shown in the figure <ref> http://itu.jrc.ec.europa.eu/index.php?id=204, Wed. 04/10/2013 </ref>

U-233 -> Th-229, emitted alpha particles have energy of 4.8 MeV.
Insert energy distribution for Betas
The following table shows the negative beta emitter nuclides,their parent nuclides, and their half lives:
| Nuclides | energy (MeV) | half life |
| 0.357 | 14d. | |
| 1.426 | 46min. | |
| 1.981 | 2.2 min. | |
| 0.644 | 3.25h | |
| 1.893 | stable |
What is the energy distribution after the 1 mm FR4 shutter
electron shutter penetration
The energy distribution below represents the incidence electron on a 1 mm FR4 shutter.
![]()
graph of electron energy for electron penetrating shutter (did any not penetrate?, how many?)
photons below were produced by above incident electron?
The energy distribution of photons was observed on the opposite side of the shutter
![]()
Electrons (with least energy from U-233= 0.2 MeV) pass through the shutter have the energy distribution below.
alpha shutter penetration
photons
Number of ions produced from Beta and Photon in ArCo2
EMTest10 is used to calculate the average number of ions (electrons) when a 101 beta of 1 MeV are fired in a world that contains ArCO2. (13.5 per primary electron).
![]()
The needed time to observe the GEM signal
In the case of triple GEM detector with a gas flow of 0.3 SCFH and 2650V and 2950V on GEM cards and cathode successively, a signal lower than the noise (of 16 mV and amplified twice) is observed at 770.0s +/- 0.1.
The normal rate (8 MHz +/- 2 as measured by the oscilloscope) is observed after 952.9s +/- 0.1.
THGEM card tasks and tests
- New THGEM cards
Two new fully machined cards are going to be tested in air and ArCH4, if they passes 2000 V potential bwtween the top and the bottom, then they are going to be installed in ArCh4 gas chamber.
The older THGEM cards will have a high voltage enough to have one spark/min to clean impurities or surface defects.
GEM Signal after the latest modification on the fission chamber 07/01/13
The signal of the detector is observed as the shutter is open and close.
| shutter close | ||||
| shutter open |
GEM's signal testing when it a long cable is used
The GEM signal is tested when a long cable is used to transfer the signal to the oscilloscope as the shutter is open, and without the cable. Oscilloscope pictures shows an attenuation to the signal up to 30%.
| Long bnc cable | ||
| Short bnc cable |
Roy's detector infomation and measurements
U-233 metal deposited source is measured by Protean Instrument corporation gaseous detector, has a model number of WPC9450 (serial number: 0915723)and uses (P10) gas mixture, as shown below:
| Shutter position | Alpha particles /min. | Beta particles /min. |
| Open | 6879 | 900 |
| Close | 1 | 38 |
The source was in a plate of a diameter of 16 cm which was exposed to to the sensitive part of the detector of a height of 2-3 mm.
The activity of the source is calculated based on the solid angle
where A is the count per second and W is the detector solid angle.
For the previous measurement, the solid angle is almost , so the the actvity of the source is twice the measured value in count/second.
IAC experiment producing neutrons
One of the IAC experiments produces neutrons, the neutron spectrum from Tungsten target is simulated outside and inside water (moderator) as shown in the figure below

In the simulation above , They are interested in close distances to the Tungsten target inside the water container, it is 1 ft cubed container and is made of aluminium and covered polyester.

References
THGEM design
THGEM#9
Media:Shalem_MSthesis_march2005.pdf
Media:Raz_Alon_MSthesis_Dec2007.pdf
Electric field Simulation
- Rim size dependence
File:THGEM Efield simulation.pdf
- 2010 THGEM design(s)
File:THGEM 2009 design gas efficiency.pdf
Simulations_of_Particle_Interactions_with_Matter
Voss and 3 russian references for Dy(n,x) cross sections
http://arxiv.org/abs/0903.3819 Dy photon gammas spectrum
http://www.ippe.obninsk.ru/podr/cjd/kobra13.php?SubentID=30974002
http://www.americanelements.com/thoxst.html
http://arxiv.org/pdf/physics/0404119
NIM_A535_2004_93[1]
File:NIM A590 2008 pg134 Eberhardt.pdf Prep Targets
Neutron cross sections for different elements Media:Neutron_cross_sections.pdf
http://www-nds.iaea.org/RIPL-2/
Media:n gamma cross sections at 25 keV.jpg
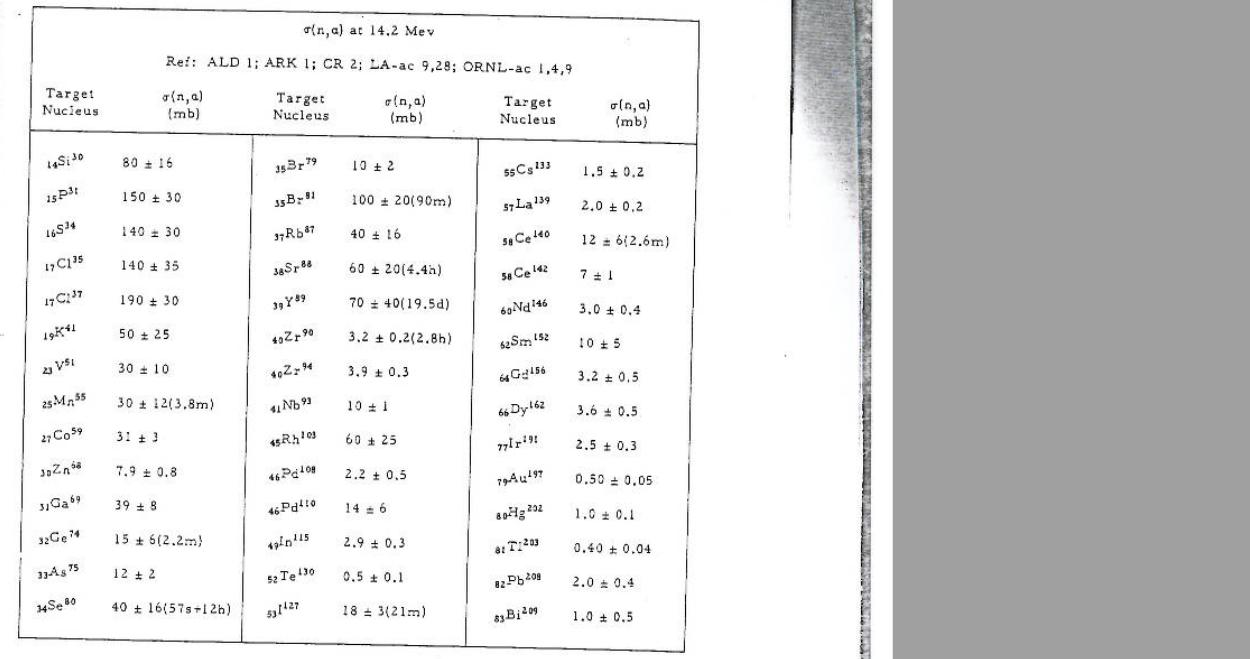
Media:n alpha cross section at 14.2 MeV.jpg
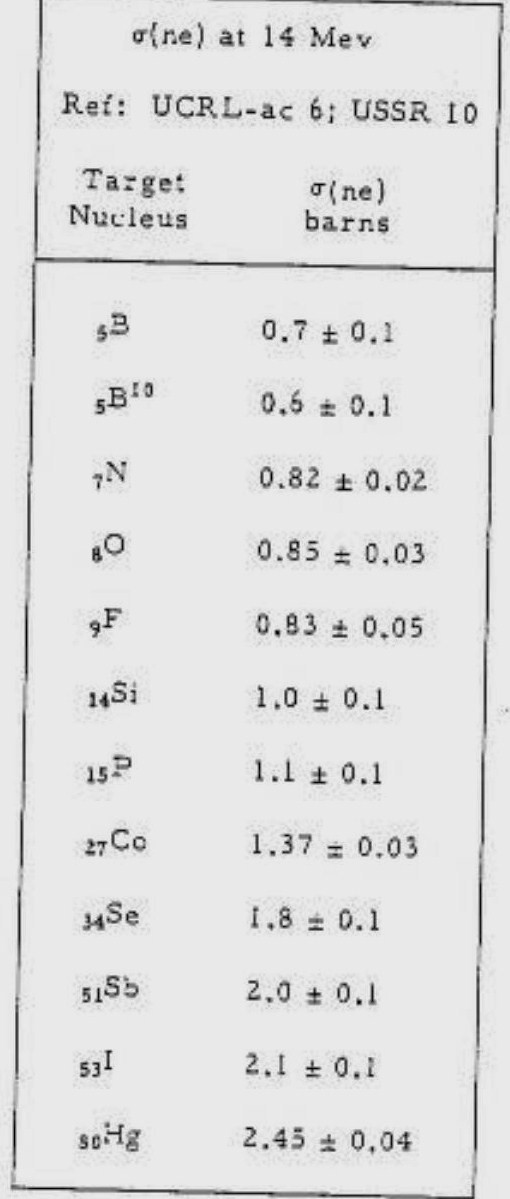
Media:ne cross section at 14 MeV.jpg
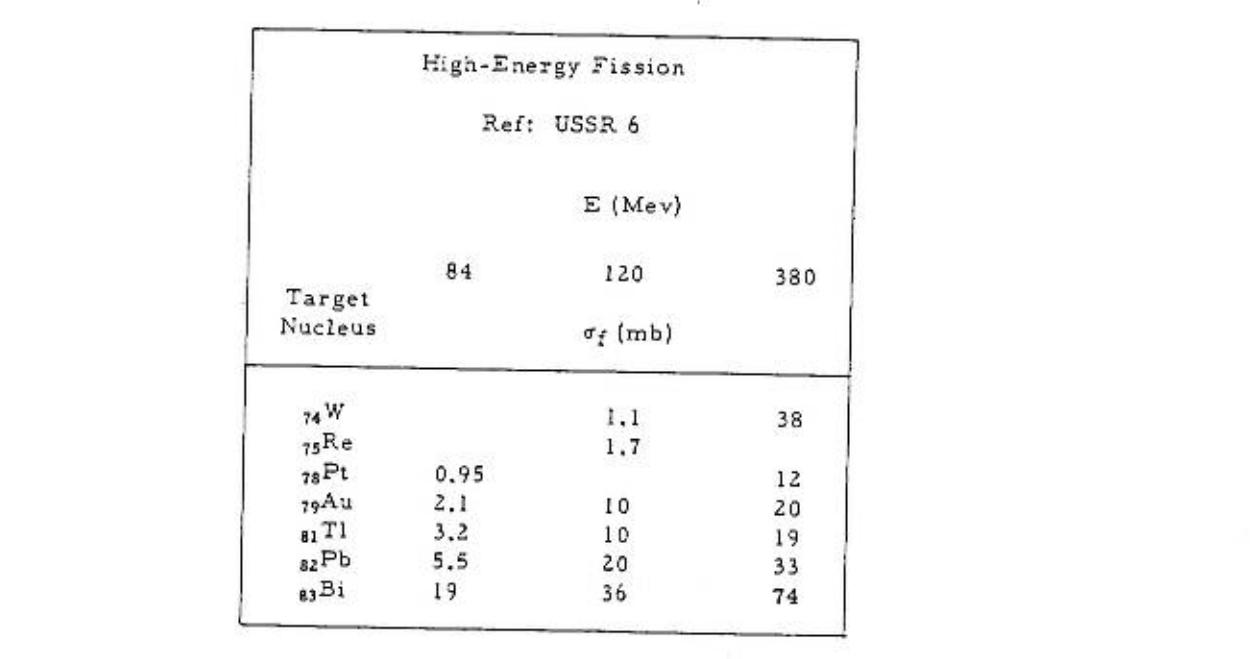
Media:high enegy fission x-section.jpg
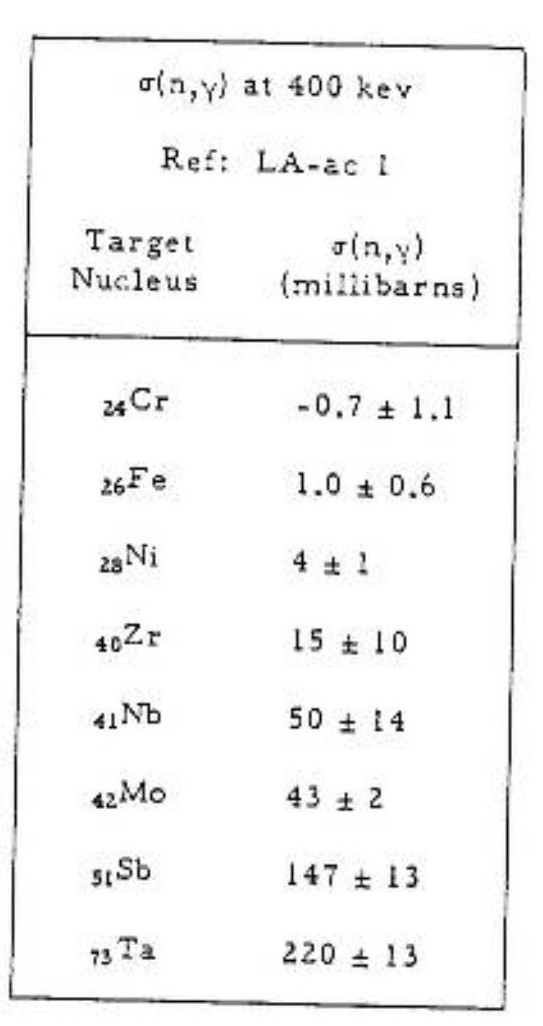
Media:N_gamma_x-section_at_400_keV.jpg
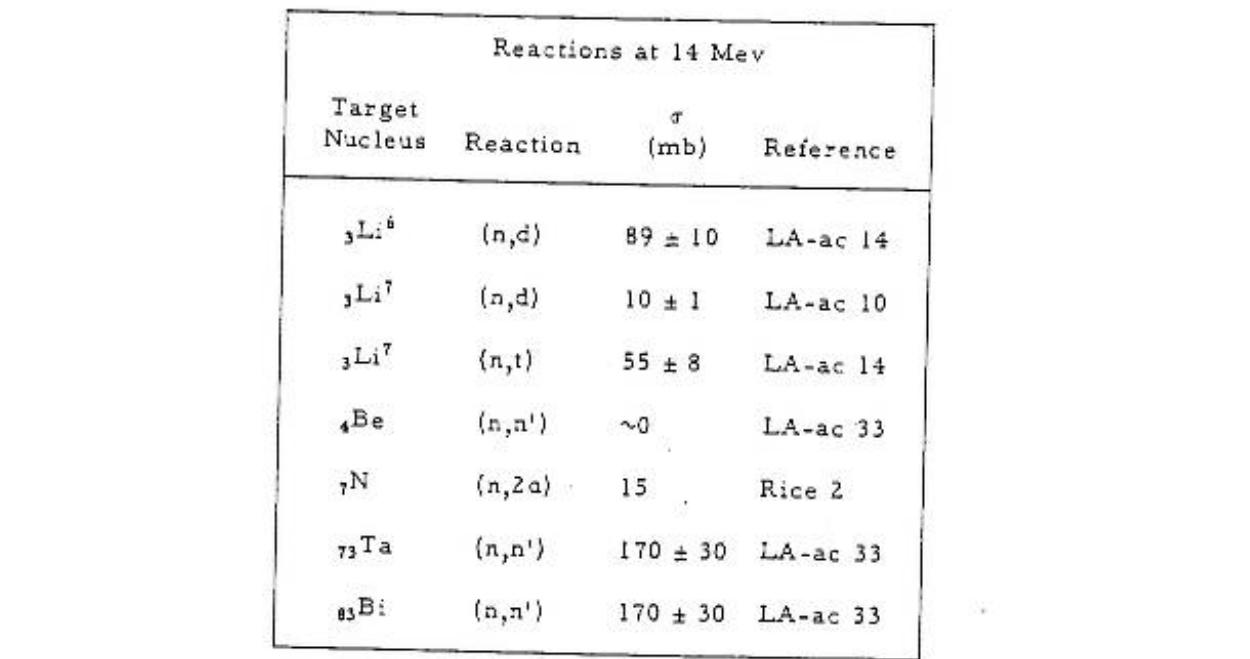
Media:x-sections of reactions at 14 MeV.jpg
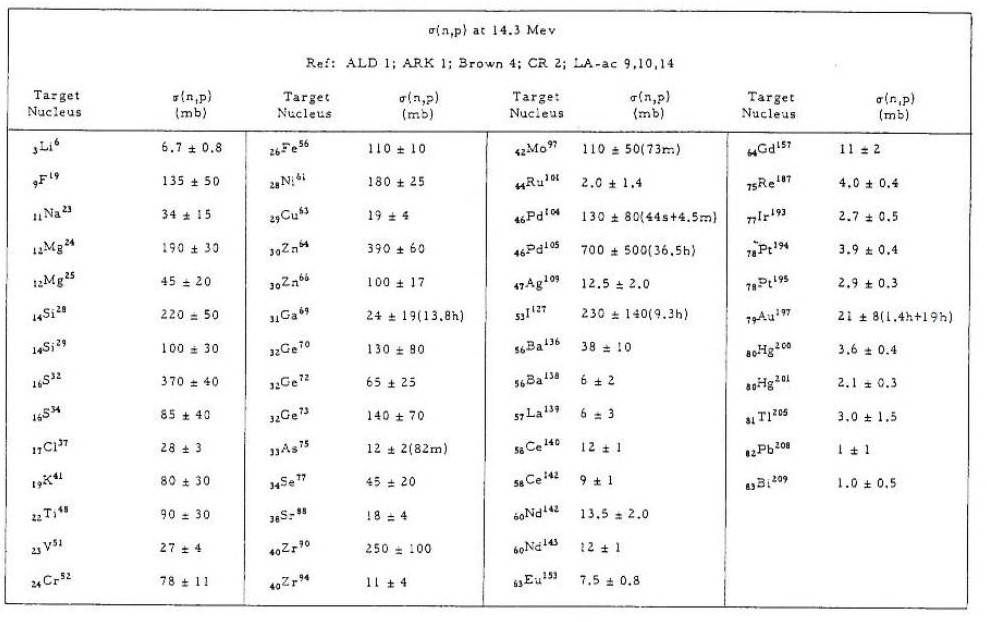
Media:n p x-section at 14.3MeV.jpg
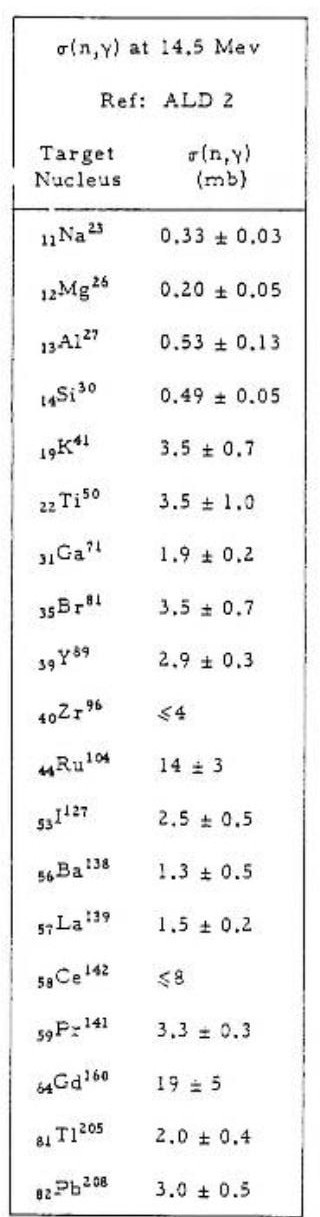
Media: n gamma x-section at 14.5 MeV.jpg
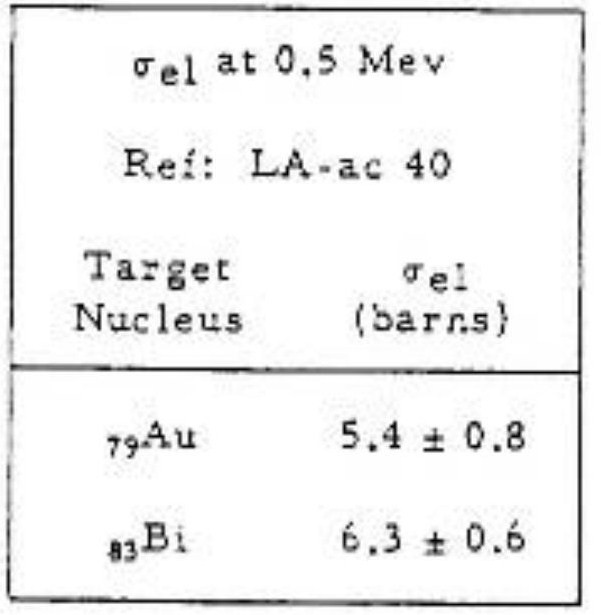
Media: elastic x-section at 0.5 MeV.jpg
Media: n gamma x-section at 1 MeV.jpg
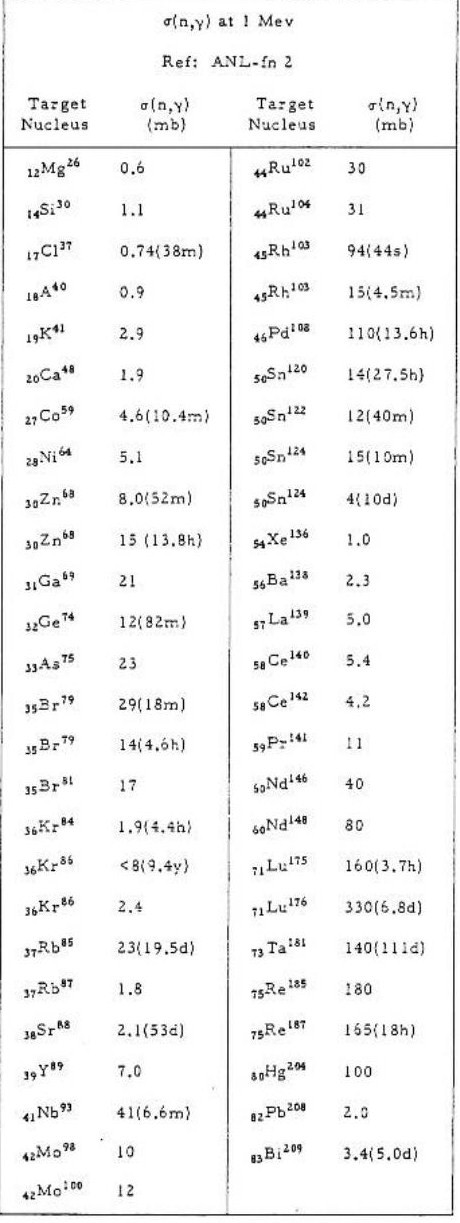
Media: n 2n x-section at 14.3 MeV.jpg
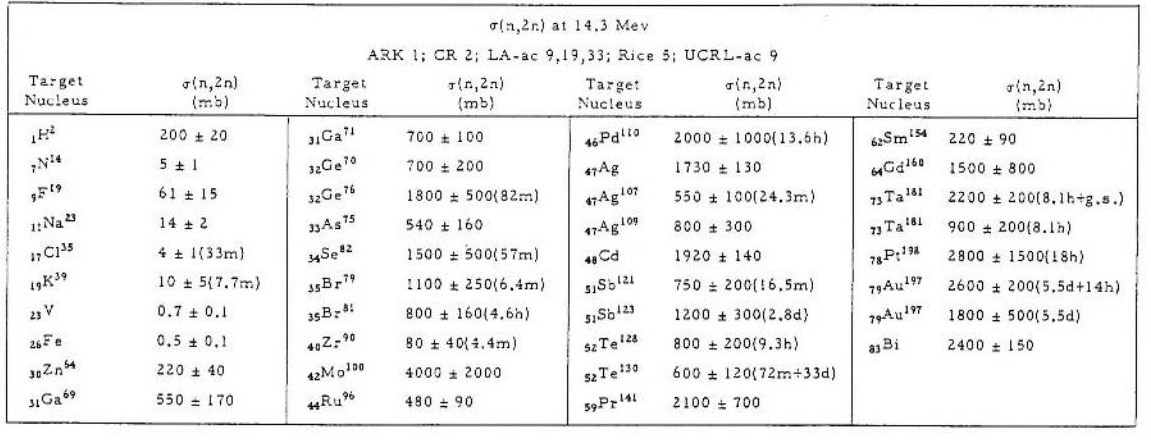
Donald James Hughes, Neutron cross sections, 2nd edition 1958, u.s.a atomic energy commission.Media:Neutron cross sections.pdf
File:NSAE 151 2005 319-334 Y.D. Lee.pdf
TGEM-2009 File:TGEM 2009.pdf
12 Volt power supply system.
http://www.lnf.infn.it/esperimenti/imagem/doc/NIMA_46128.pdf
http://electrontube.com.Media: rp097mono HV divier.pdf
http://www.cerac.com/pubs/proddata/thf4.htm#anchor550078
http://en.wikipedia.org/wiki/PC_board
GEANT4_Paticles_Models[2]
Resistors online store : http://www.justradios.com/rescart.html
RETGEMs
Media:Jinst8_02_p02012_THGEM_spark.pdf
- Thick GEM COBRA
Media: Nucl_Phys_B_Bidault_ novel UV photon detector.pdf
Media:Mauro micro pattern gaseuos detectors.pdf
Media:Development and First Tests of GEM-Like Detectors With Resistive Electrodes.pdf
http://www.supplydivision.co.uk/genitem.htm
Thick_GEM_versus_thin_GEM_in_two_phase_argon_avalanche_detectors (HV circuit)[3]
Stainless Steel deflection [4]
Data Sheets
radioactive surface cleaner NoCount MDSD File:Radioactive surface cleaner.pdf.
Th-Xsection references
File:Th-232 fxsection Behrens 0.7-1.4MeV.pdf
File:Th-232 fxsection Blons 1975 1.2-1.8MeV.pdf
File:Th-232 fxsection ermagambetov 0-3MeV.pdf
File:Th-232 fxsection Henkel 0-9MeV.pdf
File:Th-232 fxsection Ohsawa original.pdf
File:Th-232 fxsection pankratov 3-35MeV.pdf
File:Th-232 fxsection protopopov distancefromthesource.pdf
File:Th-232 fxsection rago 12.5-18MeV.pdf
U-238-Xsection and coating references
relative cross section and calibration samples characteristics for a well determined number of fissions per second
File:Eismont relative absolute nf induced intermediate energy.pdf
- U_238 cross section error analysis
INTERNATIONAL EVALUATION OF NEUTRON CROSS-SECTION STANDARDS, INTERNATIONAL ATOMIC ENERGY AGENCY,VIENNA, 2007 File:U238-xsection.pdf
U_238 (0.5-4MeV) and Th_232 (1-6MeV) fission cross section with statistical error.File:Th-232 U238 xsetion data ebars.txt
File:Pankratov fxsection Th232 U233 U235 Np237 U238 5-37MeV.pdf
Thorium Coating
ThF4 target for sputtering coatings
http://www.cerac.com/pubs/proddata/thf4.htm
Machining Uranium
Uranium will ignite in powder form
http://www.springerlink.com/content/rr072r52163x0833/
- coating Uranium
[[5]]
http://cat.inist.fr/?aModele=afficheN&cpsidt=16864172
Calorimeters/Detectors: DU sheet is in wide-scale use as an absorber material in high-energy physics research at large accelerator laboratories. The high atomic number and density of DU presents a large number of atoms per unit volume to interact with the particles emerging from collisions in these detectors. Also the slight background radiation from DU enables in situ calibration of the electronic read out devices within such detectors, thereby improving the accuracy of measurement.
http://www.2spi.com/catalog/chem/depleted-uranium-products.html
- IAEA Photonuclear Data Library [8]
- Data Acquisition
Warren_logbook[9]
Warren_Thesis [10]
Related To Gaseous Detectors
Breakdown and Detector Failure (10/21/10)
- Different kind of micro-pattern detectors
- References
1- A. Bressan, M. Hocha : NIM A 424 (1999) 321—342 File:High rate behavior and discharge limits in micro-pattern detectors .pdf
2- Fonte and Peskov IEEE 1999 :File:Fundamental limitations of high rate gaseous detectors.pdf
3- B. Schmidt: NIM A 419 (1998) 230—238 File:Microstrip gas chambers Recent developments radiation damage.pdf
Ideas
1.) Can we mix resistive paste (Encre MINICO) with TH-232. We construct a "bed of nails" to place a predrilled G-10 board with a copper border. The nails fill in the holes of the G-10 to keep the paste out. Ecre MINICO is a resistive paste used for transistors.
a.) Get some resistive paste.
http://www.leggesystems.com/p-253-elimstat-uxm-ccp.aspx
Resistive glue to compare
http://www.ellsworth.com/conformal.html?tab=Products
http://www.ellsworth.com/display/productdetail.html?productid=764&Tab=Products
http://www.ellsworth.com/display/productdetail.html?productid=2067&Tab=Products
http://www.cotronics.com/vo/cotr/ea_electricalresistant.htm
b.) mix with a metal similar to Th-232.
c.) construct bed of 0.4 mm nails. Look for 0.4 mm diameter pins.
7/31/2009
New vendor for carbon paste.
http://www.electrapolymers.com/productItem.asp?id=33
The data sheet does not show any information about the thickness of the paste.
The company has a distributor in the usa (877)-867-9668. A phone call is expected on Sat. 8/3/2009 about the availability of the product.
TGEM Mask Design
Coating U-238 or Th-232 is essential for neutron detection in the range 2-14 MeV, but THGEM contains holes that should be protected from any coating material. So, a mask is designed to cover these holes. The holes are in drilled to be on the corners of hexagonal of 1mm side length as in the figure:

The mask is made of stainless steel, 10 um laser tolerance with cut the plate to get the shape in the figure:

Please look at the following files for more details:
Make number bold black font. Add color so it is clear that they are holes in a material.
P_D
Performance of THGEM as a Neutron Detector
Vendor
Thick Film Screen Printers
http://www.sciquip.com/browses/browse_Cat.asp?Category=Screen+Printers
http://www.marubeni-sunnyvale.com/screen_printing.html
tektronix oscilloscope
134.50.3.73
<references/>