Difference between revisions of "MiniPrototype CAEN V792 Calibration"
| (29 intermediate revisions by the same user not shown) | |||
| Line 2: | Line 2: | ||
=12/11/07= | =12/11/07= | ||
| + | |||
| + | == 50 dB attenutation signal== | ||
| + | |||
| + | The preamp input signal of XX mV was attenutated 50 dB. The preamp output from both drift chambers was sampled with the ADC. Both Drift chambers HV's were unplugged and the preamp was powered to 5.8 V. | ||
| + | |||
| + | Run 192 | ||
| + | |||
| + | [[Image:ADC_V792_Calib_50dB_Output_12-11-07_Histo.gif | 200 px]] | ||
| + | |||
| + | |||
| + | Run 193. Preamp HV off | ||
| + | |||
| + | Run 194 Preamp Off, trigg rate changed from 10 Hz to 60 Hz | ||
| + | |||
| + | Run 195 Preamp Off, trigg rate changed from 10 Hz to 550 Hz | ||
| + | |||
| + | Run 196 Preamp Off, trigg rate changed from 10 Hz to 250 Hz | ||
| + | |||
| + | Run 197 Preamp Off, trigg rate changed from 10 Hz to 300 Hz | ||
== 7 mV Signal== | == 7 mV Signal== | ||
| Line 7: | Line 26: | ||
Here is a scope picture of the signal coming out of the preamp and going into the ADC (Blue) as well as the integration gate used. The signal is about 7 mv as shown below. There is a 2 mv peak to peak noise level which has structure. | Here is a scope picture of the signal coming out of the preamp and going into the ADC (Blue) as well as the integration gate used. The signal is about 7 mv as shown below. There is a 2 mv peak to peak noise level which has structure. | ||
| − | [[Image:ADC_V792_Calib_a_12-11-07.jpg | 200 px]] | + | [[Image:ADC_V792_Calib_a_12-11-07.jpg | 200 px]] |
| + | <math>Q=I \Delta t = \frac{V}{R} \Delta t = \frac{\mbox{Area of trace}}{R} = \frac{2 \times \frac{1}{2} (20 ns) (7 mV) + (36 ns) (7 mV)}{50 \Omega} = (7.84 \pm 2) \times 10^{-12} coul</math> Error estimate of 25 % is just a guess | ||
[[Image:ADC_V792_Calib_a_noise_12-11-07.jpg | 200 px]] | [[Image:ADC_V792_Calib_a_noise_12-11-07.jpg | 200 px]] | ||
[[Image:ADC_V792_Calib_a_noise_2_12-11-07.jpg | 200 px]] | [[Image:ADC_V792_Calib_a_noise_2_12-11-07.jpg | 200 px]] | ||
| Line 18: | Line 38: | ||
[[Image:ADC_V792_Calib_7mV_Ped_12-11-07_Histo.gif | 200 px]] | [[Image:ADC_V792_Calib_7mV_Ped_12-11-07_Histo.gif | 200 px]] | ||
[[Image:ADC_V792_Calib_7mV_S_12-11-07_Histo.gif | 200 px]] | [[Image:ADC_V792_Calib_7mV_S_12-11-07_Histo.gif | 200 px]] | ||
| + | : Signal - Ped =<math> (343.5 \pm 0.9 ) - (56.18 \pm< 0.3) = 287.3 \pm \sqrt{0.9^2 + 0.3^2} = 287.3 \pm 0.9</math> Channels | ||
| + | : ADC conversion <math>= \frac{7.84 \pm 2 \times 10^{-12} \mbox{Coul}}{287.3 \pm 0.9 \mbox{Chan}} = 27 \pm 7 \; \frac{f\mbox{Coul}}{\mbox{Chan}}</math> | ||
| + | |||
| + | I was expecting <math> 100 \frac{f\mbox{Coul}}{\mbox{Chan}}</math>. The signal was split between the ADC and the Scope so there is a factor of 2 but this stil comes up short. | ||
== 20 mV signal == | == 20 mV signal == | ||
| Line 24: | Line 48: | ||
[[Image:ADC_V792_Calib_S20mV_12-11-07.jpg | 200 px]] | [[Image:ADC_V792_Calib_S20mV_12-11-07.jpg | 200 px]] | ||
| + | <math>Q=I \Delta t = \frac{V}{R} \Delta t = \frac{\mbox{Area of trace}}{R} = \frac{2 \times \frac{1}{2} (20 ns) (26 mV) + (36 ns) (26 mV)}{50 \Omega} = (29.12 \pm 7) \times 10^{-12} coul</math> Error estimate of 25 % is just a guess | ||
The data was then collected using coda and recorded as run #190. A histogram of channel #1 is shown below. | The data was then collected using coda and recorded as run #190. A histogram of channel #1 is shown below. | ||
| Line 30: | Line 55: | ||
[[Image:ADC_V792_Calib_20mV_Ped_12-11-07_Histo.gif | 200 px]] | [[Image:ADC_V792_Calib_20mV_Ped_12-11-07_Histo.gif | 200 px]] | ||
[[Image:ADC_V792_Calib_20mV_S_12-11-07_Histo.gif | 200 px]] | [[Image:ADC_V792_Calib_20mV_S_12-11-07_Histo.gif | 200 px]] | ||
| + | : Signal - Ped =<math> (542.2 \pm 1.1 ) - (101.8 \pm< 2.5) = 440.4 \pm \sqrt{1.1^2 + 2.5^2} = 440.4 \pm 2.7</math> Channels | ||
| + | : ADC conversion <math>= \frac{(29.12 \pm 7) \times 10^{-12} \mbox{Coul}}{440.4 \pm 2.7 \mbox{Chan}} = 66 \pm 16 \; \frac{f\mbox{Coul}}{\mbox{Chan}}</math> | ||
| + | I was expecting <math> 100 \frac{f\mbox{Coul}}{\mbox{Chan}}</math>. The signal was split between the ADC and the Scope so there is a factor of 2. This would put the conversion to <math>(132 \pm 33\frac{f\mbox{Coul}}{\mbox{Chan}})</math> in agreement with manual. | ||
== 100 mV signal == | == 100 mV signal == | ||
| Line 37: | Line 65: | ||
[[Image:ADC_V792_Calib_S100mV_12-11-07.jpg | 200 px]] | [[Image:ADC_V792_Calib_S100mV_12-11-07.jpg | 200 px]] | ||
| + | <math>Q=I \Delta t = \frac{V}{R} \Delta t = \frac{\mbox{Area of trace}}{R} = \frac{2 \times \frac{1}{2} (20 ns) (110 mV) + (36 ns) (110 mV)}{50 \Omega} = (123.2 \pm 30) \times 10^{-12} coul</math> Error estimate of 25 % is just a guess | ||
The data was then collected using coda and recorded as run #191. A histogram of channel #1 is shown below. | The data was then collected using coda and recorded as run #191. A histogram of channel #1 is shown below. | ||
| Line 67: | Line 96: | ||
|Chan 15 | |Chan 15 | ||
|Chan 16 | |Chan 16 | ||
| + | |- | ||
| + | |0 || || || || || || || || || || || || || || || || | ||
|- | |- | ||
|7 || || || || || || || || || || || || || || || || | |7 || || || || || || || || || || || || || || || || | ||
| Line 72: | Line 103: | ||
|20|| || || || || || || || || || || || || || || || | |20|| || || || || || || || || || || || || || || || | ||
|- | |- | ||
| − | |100 || || || || || || || || || || || || || || || || | + | |100 || 1538 || 1625 || 1666 || 510 || 1640 || 1661 || 648 || 648 || 605 || 1640 || 1685 || 1672 || 1684 || 1611 || 1084 || 587 |
|- | |- | ||
|}<br> | |}<br> | ||
Latest revision as of 16:55, 20 December 2007
I injected a signal into the Drift chamber preamps and read it out using the CAEN V792 ADC.
12/11/07
50 dB attenutation signal
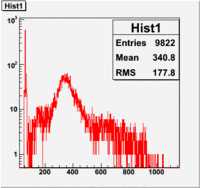
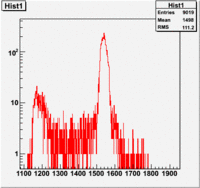
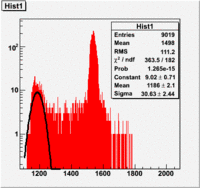
The preamp input signal of XX mV was attenutated 50 dB. The preamp output from both drift chambers was sampled with the ADC. Both Drift chambers HV's were unplugged and the preamp was powered to 5.8 V.
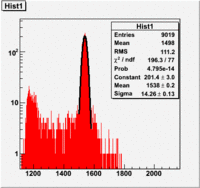
Run 192
Run 193. Preamp HV off
Run 194 Preamp Off, trigg rate changed from 10 Hz to 60 Hz
Run 195 Preamp Off, trigg rate changed from 10 Hz to 550 Hz
Run 196 Preamp Off, trigg rate changed from 10 Hz to 250 Hz
Run 197 Preamp Off, trigg rate changed from 10 Hz to 300 Hz
7 mV Signal
Here is a scope picture of the signal coming out of the preamp and going into the ADC (Blue) as well as the integration gate used. The signal is about 7 mv as shown below. There is a 2 mv peak to peak noise level which has structure.
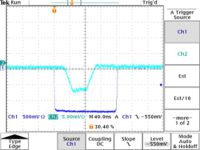 Error estimate of 25 % is just a guess
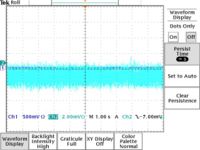
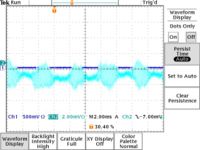
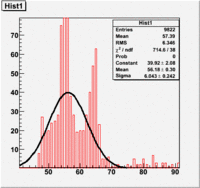
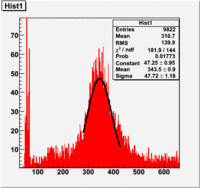
The data was then collected using coda and recorded as run #189. A histogram of channel #1 is shown below.
- Signal - Ped = Channels
- ADC conversion
I was expecting . The signal was split between the ADC and the Scope so there is a factor of 2 but this stil comes up short.
20 mV signal
Reducing the attenuation, a 20 mV signal was sent into the ADC.
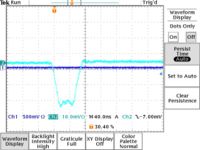 Error estimate of 25 % is just a guess
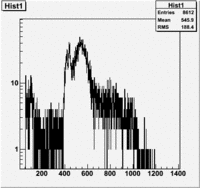
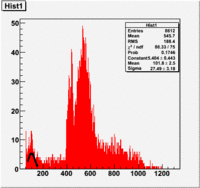
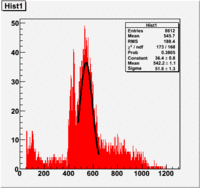
The data was then collected using coda and recorded as run #190. A histogram of channel #1 is shown below.
- Signal - Ped = Channels
- ADC conversion
I was expecting . The signal was split between the ADC and the Scope so there is a factor of 2. This would put the conversion to in agreement with manual.
100 mV signal
Reducing the attenuation, a 100 mV signal was sent into the ADC.
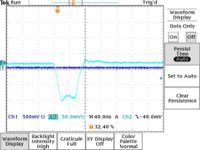 Error estimate of 25 % is just a guess
The data was then collected using coda and recorded as run #191. A histogram of channel #1 is shown below.
Calibration
Plastik's output is going into channels 1-7 and Metalicas output into 10-16. Drift Chamber High Voltage is off and preamp is powered to 5.8 volts. The post amp is not being used.
| Input (mV) | Chan 1 | Chan 2 | Chan 3 | Chan 4 | Chan 5 | Chan 6 | Chan 7 | Chan 8 | Chan 9 | Chan 10 | Chan 11 | Chan 12 | Chan 13 | Chan 14 | Chan 15 | Chan 16 |
| 0 | ||||||||||||||||
| 7 | ||||||||||||||||
| 20 | ||||||||||||||||
| 100 | 1538 | 1625 | 1666 | 510 | 1640 | 1661 | 648 | 648 | 605 | 1640 | 1685 | 1672 | 1684 | 1611 | 1084 | 587 |
