Difference between revisions of "MiniPrototype CAEN V792 Calibration"
Jump to navigation
Jump to search
| Line 2: | Line 2: | ||
=12/11/07= | =12/11/07= | ||
| + | |||
| + | == 7 mV Signal== | ||
Here is a scope picture of the signal coming out of the preamp and going into the ADC (Blue) as well as the integration gate used. The signal is about 7 mv as shown below. There is a 2 mv peak to peak noise level which has structure. | Here is a scope picture of the signal coming out of the preamp and going into the ADC (Blue) as well as the integration gate used. The signal is about 7 mv as shown below. There is a 2 mv peak to peak noise level which has structure. | ||
| Line 14: | Line 16: | ||
[[Image:ADC_V792_Calib_a_12-11-07_Histo.jpg | 200 px]] | [[Image:ADC_V792_Calib_a_12-11-07_Histo.jpg | 200 px]] | ||
| + | |||
| + | == 20 mV signal == | ||
| + | |||
| + | Reducing the attenuation, a 20 mV signal was sent into the ADC. | ||
| + | |||
| + | [[Image:ADC_V792_Calib_S20mV_12-11-07.jpg | 200 px]] | ||
| + | |||
| + | The data was then collected using coda and recorded as run #190. A histogram of channel #1 is shown below. | ||
| + | |||
| + | [[Image:ADC_V792_Calib_S20mV_12-11-07_Histo.jpg | 200 px]] | ||
Revision as of 17:12, 11 December 2007
I injected a signal into the Drift chamber preamps and read it out using the CAEN V792 ADC.
12/11/07
7 mV Signal
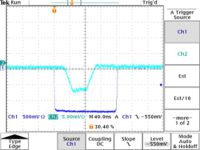
Here is a scope picture of the signal coming out of the preamp and going into the ADC (Blue) as well as the integration gate used. The signal is about 7 mv as shown below. There is a 2 mv peak to peak noise level which has structure.
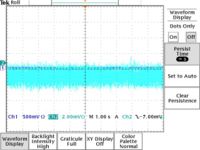
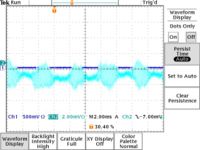
The data was then collected using coda and recorded as run #189. A histogram of channel #1 is shown below.
20 mV signal
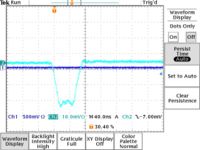
Reducing the attenuation, a 20 mV signal was sent into the ADC.
The data was then collected using coda and recorded as run #190. A histogram of channel #1 is shown below.


