Looking at effects of Solenoid on Phi Shifts
Using Moller Data to alter energy range
Using the Moller event file MollerScattering_NH3_4e8incident.dat, we can use the fact that GEMC will only create a particle based on the Moller electron. While the data for the scattered electron is passed within a LUND file, kinematically this electron doesn't leave the beam area, and thus never enters the detectors to be recreated. Since the solenoid's purpose is draw electrons trajectories closer the the beam line any electron close the the beam line will be drawn even closer, ensuring that it is never recreated in a GEMC simulation.
We can alter the energy conversion from MollerScattering_NH3_4e8incident.dat to investigate the energy-phi shift relationship
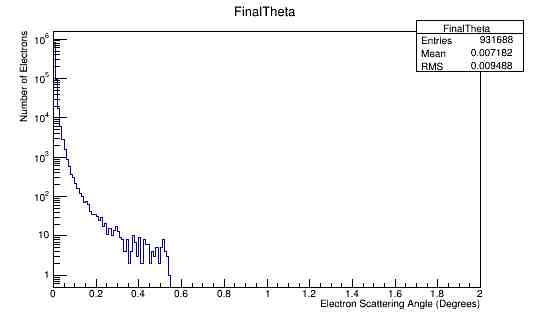
Plotting Scattering angle Theta vs. Total Energy for the Moller electron in both the Lab frame and the CM frame.
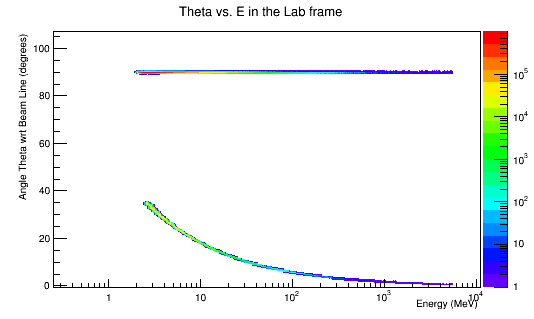
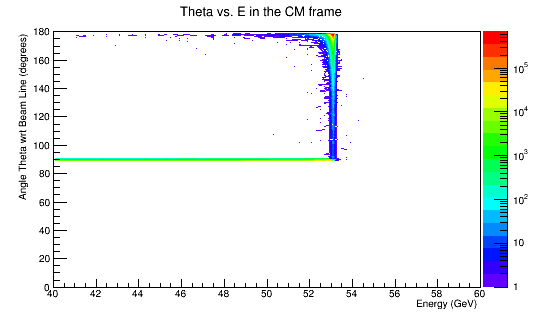
For Moller electrons at theta of 90 degrees, these particles will not enter the detector and as a result are of no concern.
Using the fact that the minimum momentum of MollerScattering_NH3_4e8incident.dat is about 2 MeV,
awk 'NR == 1 {line = $0; min = $15} NR >1 && $15 < min {line =$0; min =$15} END{print line}' MollerScattering_NH3_4e8incident.dat

11000    0     0     11000.5     0     0     0     10997.9     1.42548     -0.177032     10998.4     0     0     0     2.01929     -1.42548     0.177032     2.01939     0     0     0
and the maximum of about 5500 MeV,
awk 'NR == 1 {line = $0; max = $15} NR >1 && $15 > max {line =$0; max =$15} END{print line}' MollerScattering_NH3_4e8incident.dat

11000    0     0     11000.5     0     0     0     5500.31     28.1338     -44.9298     5500.56     0     0     0     5498.52     -28.1338     44.9298     5498.78     0     0     0
At this energy for the scattered electron:
Relativistically, the x and y components remain the same in the conversion from the Lab frame to the Center of Mass frame, since the direction of motion is only in the z direction.
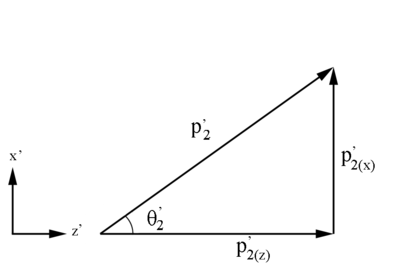
This is still within the 7 degrees of the detector "cone" with respect to the beam line.
We can alter the lines
    Px=evt.FnlMom[0]/1000;
                Py=evt.FnlMom[1]/1000;
                Pz=evt.FnlMom[2]/1000;
                px=evt.MolMom[0]/1000;
                py=evt.MolMom[1]/1000;
                pz=evt.MolMom[2]/1000;

                KE=evt.FnlKE/1000;
                ke=evt.MolKE/1000;
Dividing by 1 will give us a distribution of 2GeV-5500 GeV.
Divinding by 10 will give us a distribution of 0.2GeV-550 GeV
Dividing by 100 will give us a distribution of 0.02GeV-55 GeV
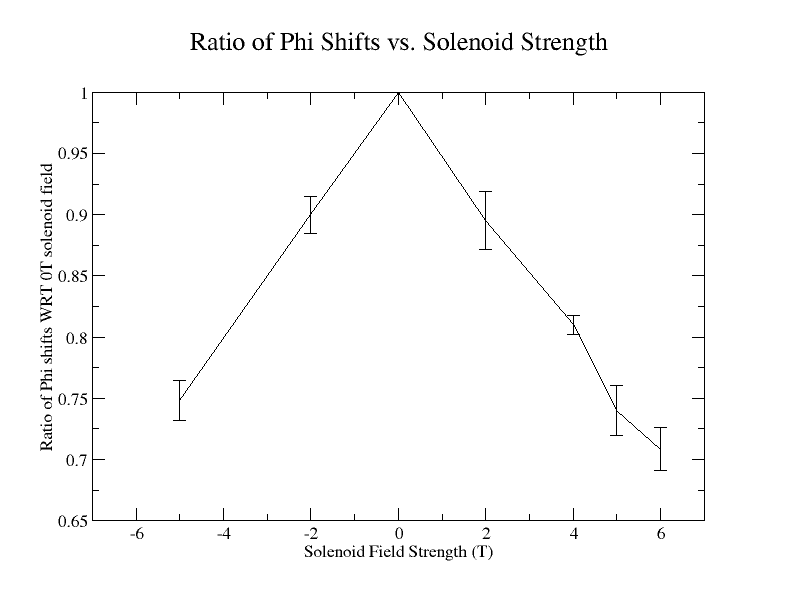
Solenoid effect > 2GeV
The number of of reconstructed GEMC events registering a shift in their phi angle due to the magnetic field of the solenoid are recorded. This is repeated for each of the five unique LUND files for each of the 7 magnetic fields being investigated. A similar process of recording the number of phi shifts is repeated for each magnetic field. Each quantity of phi shifts for non-zero magnetic fields is normalized with respect to the number of phi shifts at with the corresponding LUND file for 0T (). This information is used to find the corrected sample standard deviation:
Creating a dat file with the magnetic field, phi shift, and the corrected sample standard deviation:
| Magnetic Field (T) | (degrees) | (degrees) |
|---|---|---|
| -5 | 0.748315 | 0.0164881 |
| -2 | 0.899798 | 0.0147794 |
| 0 | 1 | 0 |
| 2 | 0.895382 | 0.0235786 |
| 4 | 0.809941 | 0.00795766 |
| 5 | 0.740047 | 0.0201546 |
| 6 | 0.708541 | 0.0172073 |
Xmgrace can be used to plot this:
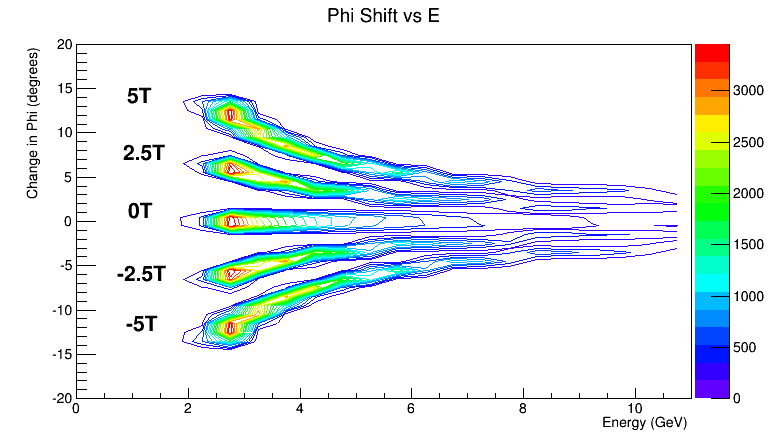
Investigating a plot of the distribution of the particles energy as a function of the change in the angle phi for the different magnetic fields.
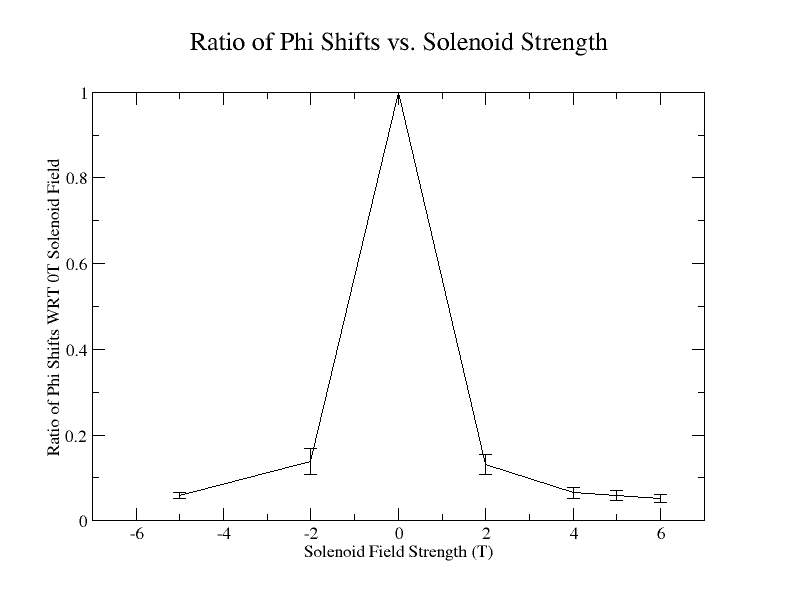
Solenoid effect > 200 MeV
Creating a dat file with the magnetic field, phi shift, and the corrected sample standard deviation:
| Magnetic Field (T) | (degrees) | (degrees) |
|---|---|---|
| -5 | 0.0585341 | 0.00740803 |
| -2 | 0.138686 | 0.0308416 |
| 0 | 1 | 0 |
| 2 | 0.131325 | 0.0234678 |
| 4 | 0.0646613 | 0.0133132 |
| 5 | 0.059031 | 0.0122767 |
| 6 | 0.051293 | 0.00876825 |
Xmgrace can be used to plot this:
Solenoid effect > 20MeV
No Phi shifts for Energies in this range where found in the simulation.