Difference between revisions of "LB Thesis Thin Window Analysis"
Jump to navigation
Jump to search
| Line 3: | Line 3: | ||
==Thin Window Histograms== | ==Thin Window Histograms== | ||
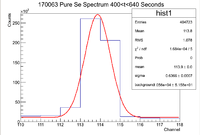
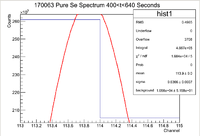
| − | Since the resolution of Detector A at the IAC is about 1 keV, the window in which the signal is viewed should have a width of 2 (whether you plot channel number or energy along the horizontal axis). Below is a sample of a signal viewed in the original window and the thin window | + | Since the resolution of Detector A at the IAC is about 1 keV, the window in which the signal is viewed should have a width of 2 (whether you plot channel number or energy along the horizontal axis). Below is a sample of a signal viewed in the original window and the thin window. The signals were fit with a function of the form |
| + | |||
| + | <math> f(x) = C + Ae^{\frac{(x-\xbar)^2}{2 \sigma^2}} </math> | ||
[[File:170063 PureSe 400 640Sec OGWindow.png|200px]] | [[File:170063 PureSe 400 640Sec OGWindow.png|200px]] | ||
Revision as of 16:09, 29 November 2017
This will be a detailed explanation of how to trace the isotope of interest's activity back to its original value. The sample of interest here is the oven ash sample with inventory number 170063.
Thin Window Histograms
Since the resolution of Detector A at the IAC is about 1 keV, the window in which the signal is viewed should have a width of 2 (whether you plot channel number or energy along the horizontal axis). Below is a sample of a signal viewed in the original window and the thin window. The signals were fit with a function of the form
This signal corresponds to the 103 keV line of Se-81. I plotted channel number instead of energy to maintain integer bins and avoid a picket fencing effect in the signal.

