LB SageBrushWork PostDefense
Time Cuts
The first step in the PAA process is to identify the time cuts used for the split run. This must be done for all samples (50%,10%,0.1%, and 0.04%) Let's do the 50% sample first
50% Sage/Se Mixture Time Cuts
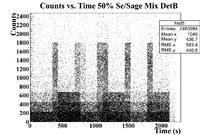
The 50% Se/Sage mixture was measure on Detector B (unshielded, so watch the SNR) on 5/24/17 for a total of 2130.540 seconds. The outer pure witness Se was measure first, and sub-run was roughly 300 seconds for the samples of interest, and 60 seconds for the Co-60 flag. The root command used to draw the timing information was
TTree* tree = MPA;
MPA->Draw("evt.Chan:evt.Sec>>hist2","evt.ADCid == 1");
which produced the histogram below
This seems a little sloppy, lets try a 1D histogram instead to see if the cuts are more clear
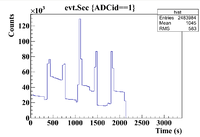
ROOT Command: MPA->Draw("evt.Sec>>hist","ADCid==1","");
This produced the histogram below
This seems much cleaner and clearly shows the time cuts
10% Sage/Se Mixture Time Cuts
0.1% Sage/Se Mixture Time Cuts
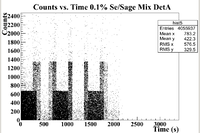
The 0.1% Se/Sage mixture was measured on Detector A (shielded) on 5/24/17 for a total of 2130.540 seconds. The mixture was measured first, and a sub-run was roughly 300 seconds for the Se samples and 60 seconds for the Co-60 flag. The root commands used were
TTree* tree = MPA;
MPA->Draw("evt.Chan:evt.Sec>>hist2","evt.ADCid == 0");
which produced the histogram below
This seems a little sloppy, so let's repeat the procedure for the 50% sample
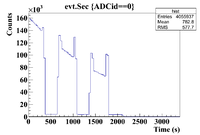
ROOT Command:ROOT Command: MPA->Draw("evt.Sec>>hist","ADCid==0","");
This produced the histogram below
This is again much better than the 2D histogram.


