Difference between revisions of "LB Det A Dead Time"
| Line 88: | Line 88: | ||
<math> A_0 \times e^{-\lambda \times t} = 10.54 \times e^{-\lambda \times 3444} = 5.6570 \mu Ci \rightarrow 209307.65 Hz | <math> A_0 \times e^{-\lambda \times t} = 10.54 \times e^{-\lambda \times 3444} = 5.6570 \mu Ci \rightarrow 209307.65 Hz | ||
| + | |||
| + | Below is a table of information about the measurements that were made along with the theoretical rate within the solid angle | ||
| + | |||
| + | {| border="3" cellpadding="5" cellspacing="0" | ||
| + | | Run || Distance from Detector (cm) || Number of Histogram Entries || Runtime (seconds) || R_{Measure} (Hz) || Solid Angle (sterradians) || <math> R_{Theory} </math> || <math> \frac{R_{Measured}}{R_{Theory}} </math> | ||
| + | |} | ||
Revision as of 15:59, 6 December 2017
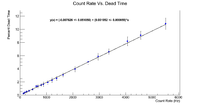
Due to the difficulty in getting the activity ratios to match the expected values, I decided to investigate the dead time of the detector in use (Detector A). Below is a table of values used to generate the plot. This will also give the reader a good idea of what the dead times are for certain count rates.
| Count Rate (Hz) | % Dead |
| 129.47 +/- 7.84 | 0.24 +/- 0.10 |
| 154.33 +/- 10.36 | 0.29 +/- 0.11 |
| 194.83 +/- 8.36 | 0.41 +/- 0.11 |
| 253.69 +/- 14.05 | 0.51 +/- 0.18 |
| 257.11 +/- 11.24 | 0.53 +/- 0.14 |
| 338.8 +/- 11.68 | 0.65 +/- 0.15 |
| 477.61 +/- 15.06 | 0.84 +/- 0.16 |
| 619.3 +/- 10.56 | 1.34 +/- 0.18 |
| 680.83 +/- 17.5 | 1.33 +/- 0.23 |
| 807.37 +/- 15.85 | 1.55 +/- 0.18 |
| 889.6 +/- 16.22 | 1.65 +/- 0.34 |
| 1051.33 +/- 26.74 | 1.92 +/- 0.26 |
| 1213.93 +/- 23.62 | 2.26 +/- 0.33 |
| 1389.45 +/- 24.75 | 2.53 +/- 0.31 |
| 1628.47 +/- 17.17 | 3.06 +/- 0.30 |
| 2084.6 +/- 33.77 | 3.95 +/- 0.42 |
| 2576.5 +/- 31.53 | 5.06 +/- 0.39 |
| 3058.20 +/- 35.62 | 5.87 +/- 0.54 |
| 3362.13 +/- 23.12 | 6.59 +/- 0.43 |
| 4067.2 +/- 45.37 | 8.18 +/- 0.66 |
| 4564.37 +/- 61.94 | 9.09 +/- 0.60 |
| 5511.6 +/- 64.60 | 10.86 +/- 0.85 |
Below is a plot of the data
Improved Measurement
Since the initial measurement of the dead time had a high error associated with the fluctuating of the count rate, a different measurement was made to try and minimized the error. This measurement was taken by using Ba-133 sources on detector A at the IAC. The source was placed at some position in front of the detector, then data was collected. For the next run the source was moved closer to the detector. A larger source was used as well in this manner to try and reach the higher dead times. The measurement gives the number of counts seen in some solid angle. I will compare this with theory by using the fact that the solid angle can be written as
We can also calculate the theoretical activity of the source. Using this we can find a theoretical rate of photons incident in the solid angle, or
Once the theoretical rate has been found, take a ratio between the measured rate and the theoretical rate to get the percent dead time, or
The source information was as follows:
The smaller source used was a 0.9671 uCi source with a reference date of January 1st, 2007 and serial number 1219-33-2
The larger source used was a 10.54 uCi source with a reference date of July 1, 2008 and serial number 129791.
Theoretical Activities
To find the theoretical activities of the sources, we must find the activity on the date that the measurement was taken. The half life of Ba-133 is 10.51 years, or 3836.15 days, which gives a decay constant of
For the smaller source, the number of days between the date printed on the source and the date of measurement, which was December 5, 2017 is 3991 days. By using the decay equation, the activity on the date of the measurement is
For the larger source, the number of days between the date printed on the source and the date of the measurement, which was December 5, 2017 is 3444 days. By using the decay equation, the activity of the source on the day of measurement is
|| |}
