LB DetLimits Thesis
50% Excluded
For this analysis, begin by using the first measurement of the Se-75 line and using the standard exponential decay equation to correct it and its error back to the time of beam off. Below is a table of the Se-75 (120d) corrected measurements as well as the front nickel foils and the Mn-54 data for each measurement. Note the Mn-54 analysis was weighted by the mass of the soil.
| Sample | Activated (total beam time) | Counted | Fully Thesis Corrected Rate @ 1st Measurement (Hz) | |
| 10% Se/Soil Mixture | 5/23/17 and 5/24/17 (83 min) | 07/18/17 (16:25:44) | 3109.68 95.39 | 4280.08 131.29 |
| 10% Se/Soil Pure Witness selenium | 5/23/17 and 5/24/17 (83 min) | 8/1/17 (16:05:51) | 4161.29 127.63 | 6210.50 190.48 |
| 10% Se/Soil Front Inner Ni Foil | 5/23/17 (1h) | 5/23/17 (15:52:21) | 385955 23488.8 | 425064.36 25868.95 |
| 10% Se/Soil Mixture Mn-54 | 5/23/17 (1h) | 07/18/17 (16:25:44) | 15.63 0.56 | 17.67 0.63 |
| 1% Sample Se/Soil Mixture | 5/23/17 (1h) | 6/23/17 (16:39:03) | 2233.33 68.52 | 2675.24 82.08 |
| 1% Sample Se/Soil Pure Witness selenium | 5/23/17 (1h) | 7/20/17 (16:39:46) | 3840.86 117.81 | 5379.43 165.00 |
| 1% Sample Se/Soil Front Inner Ni Foil | 5/23/17 (1h) | 5/23/17 (17:59:39) | 261461 16045.7 | 293170.78 17991.71 |
| 1% Sample Se/Soil Mixture Mn-54 | 5/23/17 (1h) | 6/23/17 (16:39:03) | 9.38 0.39 | 10.05 0.42 |
| 0.1% Sample Se/Soil Mixture | 5/23/17 (30 min) | 6/19/17 (18:25:18) | 849.46 26.07 | 993.59 30.49 |
| 0.1% Sample Se/Soil Pure Witness Selenium | 5/23/17 (30 min) | 07/25/17 (16:32:52) | 834.41 25.61 | 1201.58 36.88 |
| 0.1% Sample Se/Soil Front Inner Ni Foil | 5/23/17 (30 min) | 5/24/17 (14:25:39 | 118412 7280.06 | 197670.18 12152.98 |
| 0.1% Sample Se/Soil Mn-54 | 5/23/17 (30 min) | 6/19/17 (18:25:18) | 9.38 0.33 | 9.96 0.35 |
Mn-54 Efficiency
A calibrated Mn-54 source was used to find the efficiency of an 834 keV line. The source was serial #J4-348, which had an activity of 9.882 on 8/01/12, so the activity on 4/18/17 was
Now converting to Hz gives
| Source | Energy (keV) | Position | Expected Rate (Hz) | ROOT Window (keV) | HpGe Rate (Hz) | HpGe Detector A Efficiency (%) |
| Mn-54 (J4-348) | 834 | 10cm (Det A) | 8138.05 3\% | [829,839] | 25.87 0.28 | 0.32 0.01 |
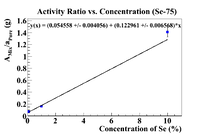
Below are plots of the activity ratio of the Se/Soil mixture and specific activity of the pure selenium pellet as a reference material. The plots also have no restrictions on the equation of the line.
Following the analysis in Nate's thesis, the initial concentration should be the intercept on the x-axis, which is
