Difference between revisions of "LB April DetB DetA Calibration"
Jump to navigation
Jump to search
| Line 17: | Line 17: | ||
==Detector B== | ==Detector B== | ||
| + | Using the file /data/IAC/Se/April_Calib_Efficiency/DetB_Calib_4_18_17.dat and the root command line | ||
| + | |||
| + | .L TempVoltageFit.C | ||
| + | TempVoltageFit(0,2); | ||
| + | |||
| + | The following plot was created | ||
| + | |||
| + | [[File:DetB Calib 4 17 17.png|200px]] | ||
| + | |||
| + | Giving values A = 0.491937 +\- 0.392529 and B = 0.808439 +\- 0.000483705 | ||
Latest revision as of 16:33, 25 April 2017
Detector A
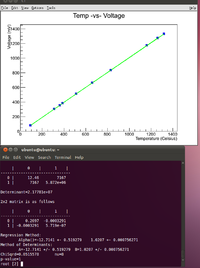
Using the program /data/IAC/Se/April_Calib_Efficiency/TempVoltageFit.C on the data file DetA_Calib.dat with the command
.L TempVoltageFit.C TempVoltageFit(0,2);
The plot given is shown below
The program returns A = -12.7141 +/- 0.0519279 and B = 1.0207 +/- 0.000756
So the draw command is Test -> Draw(-12.7141+1.0207*evt_Chan);
Detector B
Using the file /data/IAC/Se/April_Calib_Efficiency/DetB_Calib_4_18_17.dat and the root command line
.L TempVoltageFit.C TempVoltageFit(0,2);
The following plot was created
Giving values A = 0.491937 +\- 0.392529 and B = 0.808439 +\- 0.000483705

