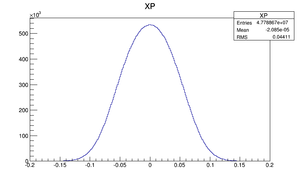
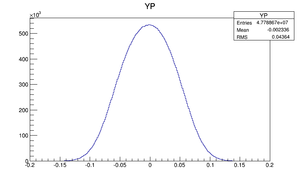
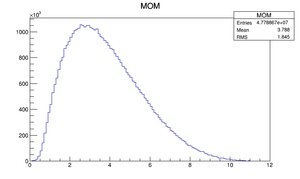
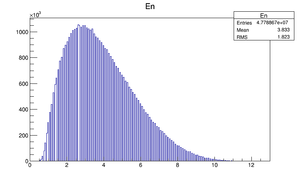
July2012PosSimulation
In G4beamline manual "The electromagnetic processes of these physics lists are advertised to be valid above a few hundred electron Volts; Geant4 has a set of low energy electromagnetic processes, indicated by a suffix “_EMX” in the physics list name."
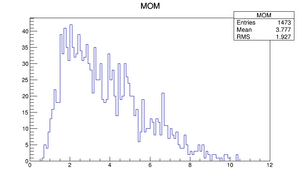
2 MeV Positrons
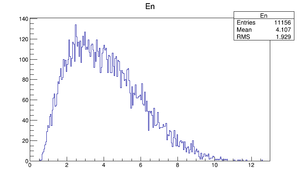
Measured Electron energy distribution at 10 MeV on 1.mm target
Simulation steps
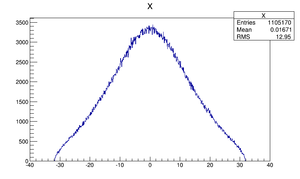
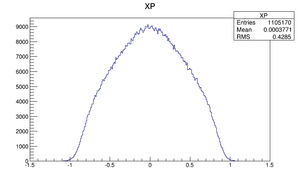
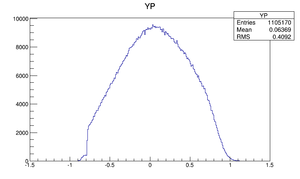
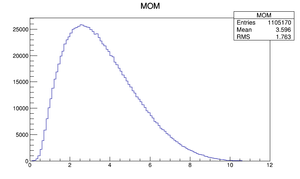
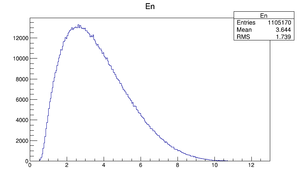
1.) GEANT4 Simulated Beam energy distribution
2.) GEANT4 Simulated Positrons emitted from 1.x mm thick target
3.) Now use above Positron distribution as the particle source for G4beamline
Positrons hitting Tungsten Converter target
4.) Use GEANT4 to determine 511s from the positrons distribution impinging converter target
Oct 16th 2012 BenchMark
stages:
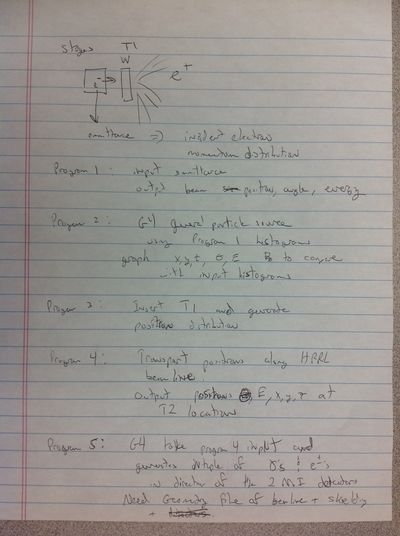
1. Program to input emittance, output beamsize, beam, divergence and beam energy.
2. e- on W, outcome e+. Incident electron distribution on T1. with general particle source with step 1 histogram. check graph x, y, z theta, En_dis out_put is the input. (directory for each).
3. insert T1 and generate positron distribution.
4. Acceleractor code to transport positron along the beamline. Out put positron theta, beamsize (x,y), energy distribution, out puts transported positron.
5. Geant4 takes step 4 output generates gamma (and other e+,e-) and look at those goes to detectors. beamline, plus shielding, and detectors.
Simulations
Partical Data Ground ID: PDGid=11 is electron. PDGid=-11 is positron. PDGid=22 is photon.
Parameters
Dipole vacuum chamber width is mm
The cavity exit diameter is about 7.3 mm.
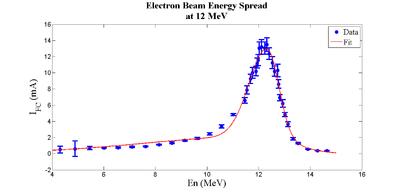
Energy Spread Two Skewed Gaussian Fit
Energy spread fitted with two skewed Gaussian.
Beam Distributions Beyond RMS: Media:Beam_Distributions_Beyond_RMS.pdf
Amplitude = 2.13894, mean = 12.07181, sigma_L = 4.46986, sigma_R = 1.20046
Sigma = 2.83516, Skewness = -0.57658
Amplitude2 = 10.88318, mean2 = 12.32332, sigma_L2 = 0.69709, sigma_R2 = 0.45170
Sigma2 = 0.57440, Skewness2 = -0.21360
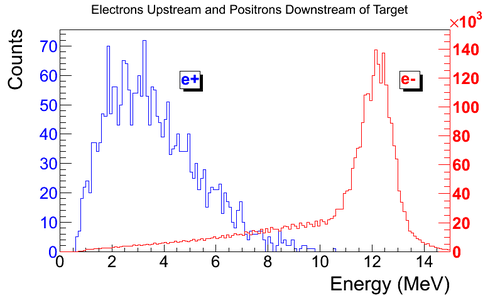
Electron Distribution Upstream and Positron Distribution Downstream of Target1
simulation: Electron Distribution Upstream and Positron Distribution Downstream of Target1
3067274 Electrons fired.
T1_s=943.5
FDT1_s=$T1_s-26.52
BDT1_s=$T1_s+26.52
Thickness of T1 is 1.016 mm, radius of T1 is 15.875 mm (0.625 inches).
Step 1: Generating positron from electron beam
Detector is after T1 to saple positron distribution. 13,799,743,800 electrons shot at the tungsten target to generate positrons.
step 1: ratio
DDNT1 = Detector DowN from T1
DQ4 = Detector at entrance Quad 4 located right after T1
DD1 = Detector at entrance of the first Dipole.
e-(DUPT1) = 13,799,743,800
e+(DDNT1) =
e+(DQ4) =
e+(DQ4) =
e-(DUPT1)/e+(DDNT1) = 1260
e-(DUPT1)/e+(DQ4) = 219811 =
e-(DUPT1)/e+(DD1) = 2046832 =
e+(DDNT1)/e+(DQ4) = 174
e+(DDNT1)/e+(DD1) = 1624
e+(DQ4)/e+(DD1) = 9.3
Step 1: Generated Beam on DDNT1
Detector down T1:
Positrons on detector right before Q4.
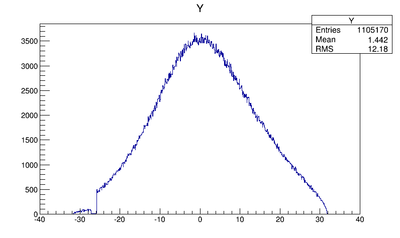
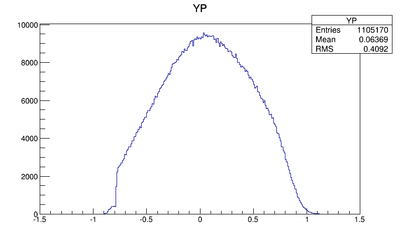
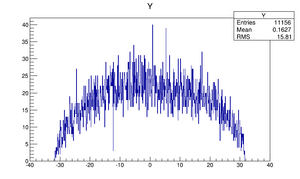
Y profile (why is the distribution clipped on the left side in the figure) 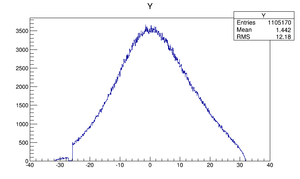
Sharp drop issue
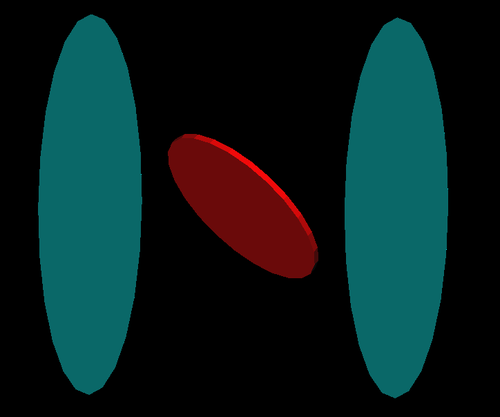
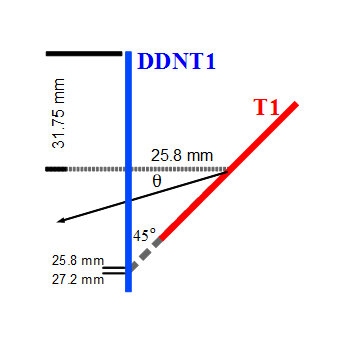
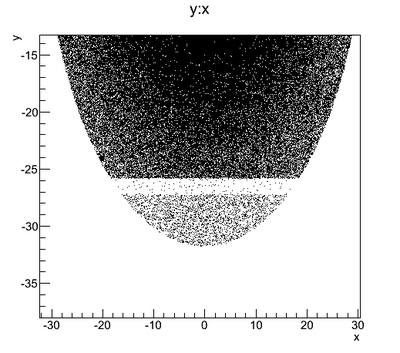
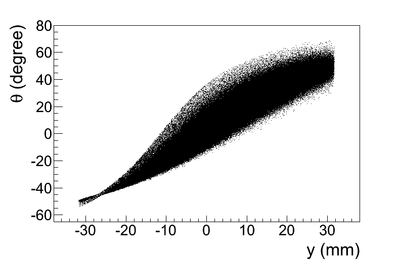
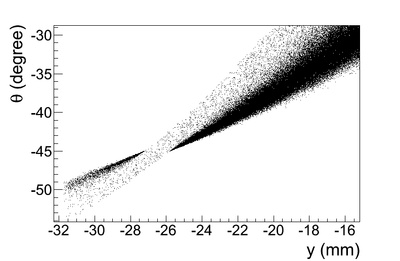
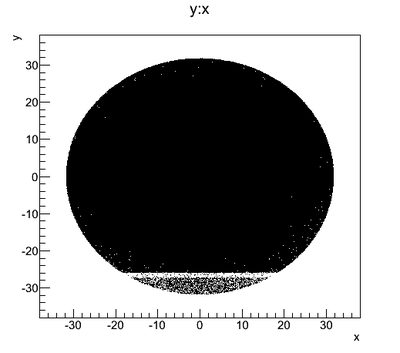
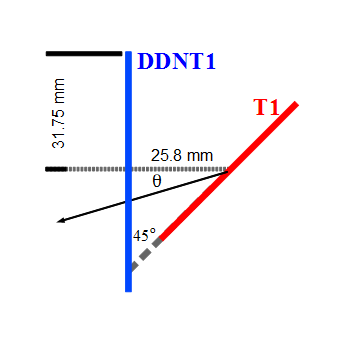
The Y-position distribution of the beam shown in Figure ~\ref{sim-DDNT1-y-vs-x} has a sharp drop in the region between -25.8 mm and -27.2 mm that corresponds to the boundary of the target T1. Figure ~\ref{sim-DDNT1-T1-geo} shows the geometry of the target T1 and the sensitive detector DDNT1. If the target size was increased, it would eventually intersected the detector DDNT1 at a distance of 25.8 mm from the beam center. A 1.4 mm wide stripe of low counts is visible on DDNT1 that is a result of the target's thickness of 1.016 mm and the 45 degree angle of intersection. (). The edge of the target does not produce many positrons compared to the face of the target, and as a result you see the stripe.
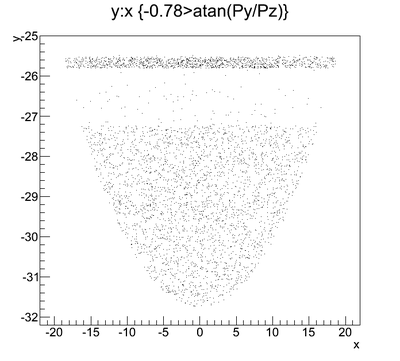
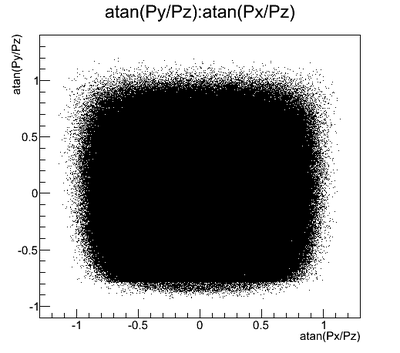
As shown in figures ~\ref{sim-DDNT1-theta-vs-y} and ~\ref{sim-DDNT1-theta-vs-y-zoom} (zoomed figure) the positron distribution decrease occures at . Positrons are emitted from both the downstream and upstream side of the target. As shown in the figure, positrons from the downstream side of the target intersect the detector at angles below 45 degrees while positrons from the upstream side of the target begin to hit the detector at angles beyond 45 degrees. The 1.4 mm gap represents the transition of positrons between these two extremes.
Cut off line is around 26.5 mm corresponding to the large angle.
DDNT1 is at 26.52 mm (53.04 mm)downstream of T1.
T1 radius is 25.4 mm (d=50.8 mm)
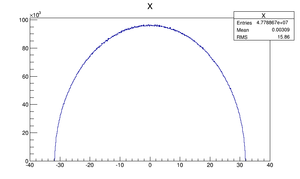
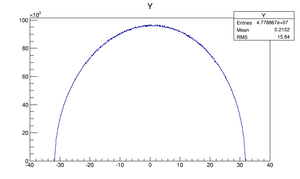
DDNT1 radius is 31.75 mm (d=63.5 mm).
Step 1: Generated Beam on DQ4
Positrons on detector right before Q4.
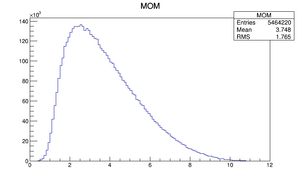
Step 1: Generated Beam on DD1
Positrons on detector right before D1 - first dipole.
Step 2: generate positron
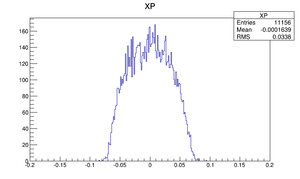
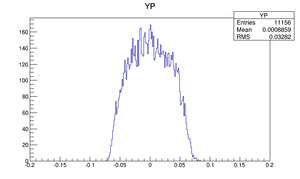
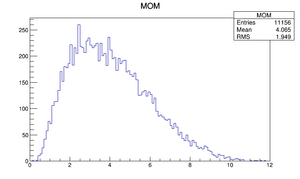
The positrons after T1 is detected on a virtual detector. The positrons beam size, divergence and momentum distributions are extracted and created new positron beam.
Generate positron beam from the detector after T1 and transport it to right before D1.
219034780*100=21,903,478,000 positrons generated.
step 2: ratio
e+(DDNT1)/e+(DQ4) = 3536518400/47788670 = 74
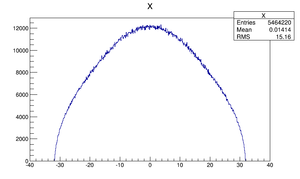
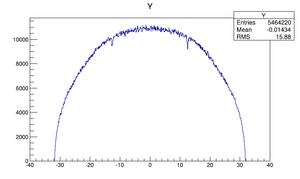
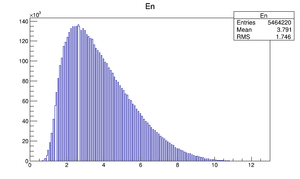
e+(DDNT1)/e+(DD1) = 3536518400/5464220 = 647
e+(DQ4)/e+(DD1) = 8.7
Generated Beam on DQ4
Positrons on detector right before Q4.
Generated Beam on DD1
Positrons on detector right before D1 - first dipole.
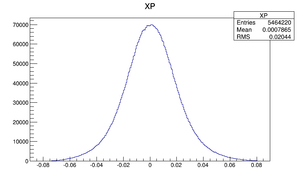
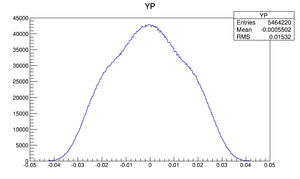
Beam Compare Step1 and Step2
Compare at DD1 of S1 and S2
| Step 1 | Step 2 | |
| X profile | 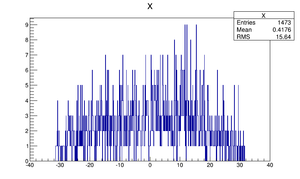 |
|
| Y profile | 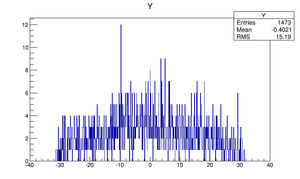 |
|
| X divergence profile | 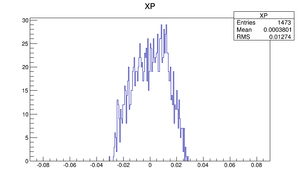 |
|
| Y divergence profile | 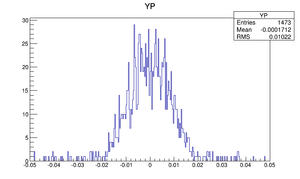 |
|
| Energy | 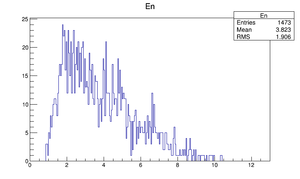 |
|
S3
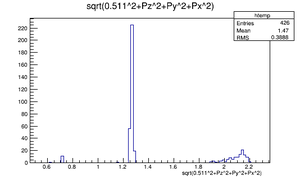
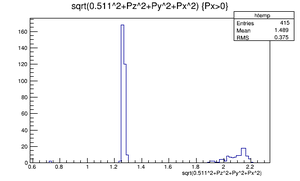
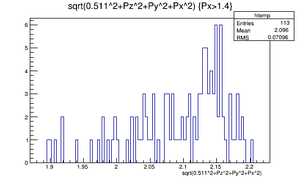
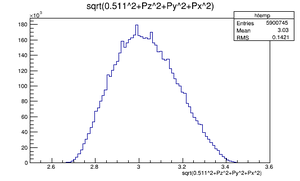
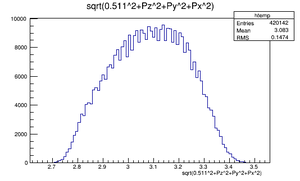
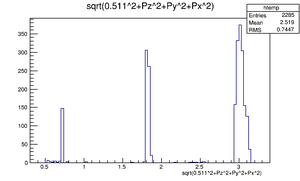
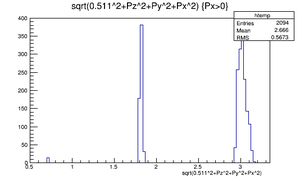
| Counts | DD1UP | DD45 | DD2ND | DT2UP | DT2UP (Px>0) | DT2UP (Px>) |
| 1 MeV | 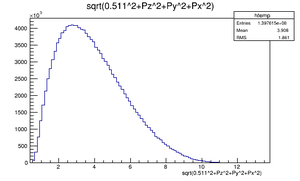 |
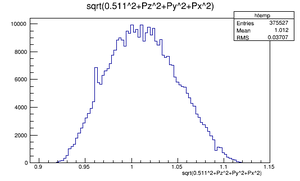 |
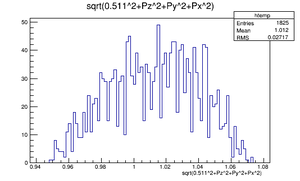 |
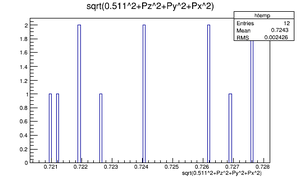 |
300 px | 300 px |
| 2 MeV | 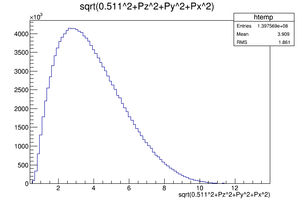 |
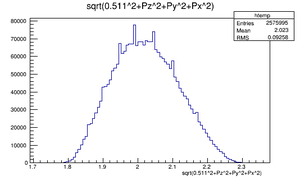 |
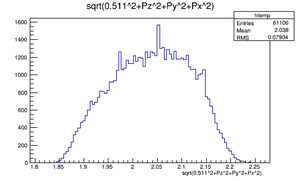 |
 |
 |
|
| 3 MeV | 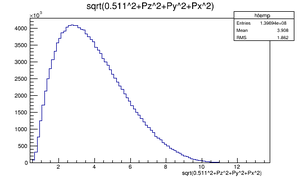 |
 |
 |
 |
 |
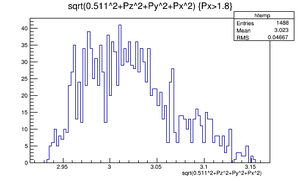
|
| 4 MeV | 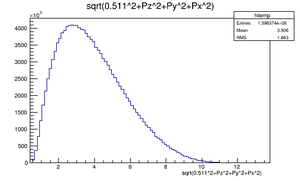 |
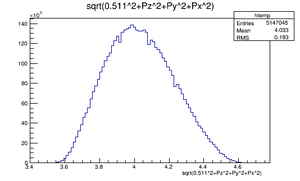 |
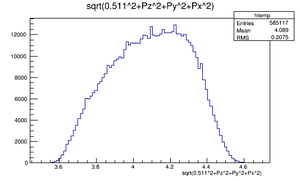 |
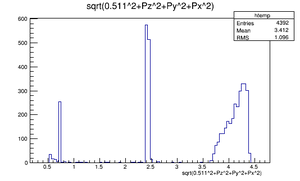 |
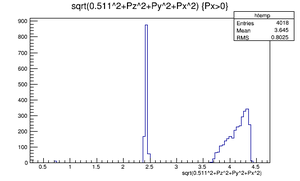 |
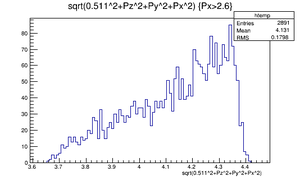
|
| 5 MeV | 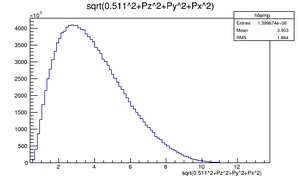 |
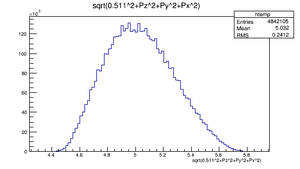 |
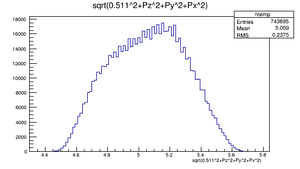 |
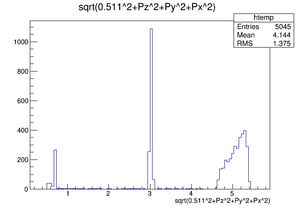 |
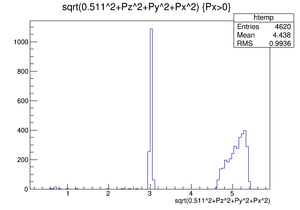 |
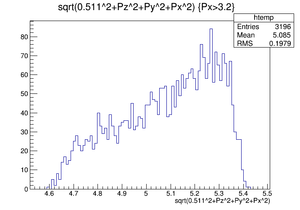
|
| Counts | DD1UP | DD45 | DD2ND | DT2UP | DT2UP (Px>0) | DT2UP (Px>) | dE/E |
| 1 MeV | |||||||
| 2 MeV | 0.3/2 = 15% | ||||||
| 3 MeV | 0.22/3 = 7% | ||||||
| 4 MeV | 4.42-3.64 = 20% | ||||||
| 5 MeV | 5.43-4.59 = 17% |
Checks
- Make delta function incident beams, does the dipole transport 100% of them
- Increase Delta E(1,3,5,10,20,40% of E), incident positrons are at 0 degrees, centered on dipole, plot loss as function of Delta E for 1,3,5 meV incident beam
- Next consider incident angle of positrons on the Quad
1 MeV
En @ DT2ND 300 px
En @ DT2ND 300 px
2 MeV
3 MeV
4 MeV
5 MeV
Dipole test
100 e+ shot to the entrance of D1.
Following table shows the number of e+ detected on each detectors.
Detector order is DD1UP->D45->DD2DN->DT2UP.
Q7 is off
| dE/E | 1 MeV | 2 MeV | 3 MeV | 4 MeV | 5 MeV |
| 0 | 100->100->100->100 | 100->100->100->100 | 100->100->100->100 | 100->100->100->100 | 100->100->100->100 |
| 0.001 | 100->100->100->100 | 100->100->100->100 | 100->100->100->100 | 100->100->100->100 | 100->100->100->100 |
| 0.003 | 100->100->81->81 | 100->100->100->100 | 100->100->100->100 | 100->100->100->100 | 100->100->100->100 |
| 0.005 | 100->100->56->56 | 100->100->100->100 | 100->100->100->100 | 100->100->100->100 | 100->100->100->88 |
| 0.01 | 100->100->100->28 | 100->100->100->90 | 100->100->100->78 | 100->100->100->54 | 100->100->100->44 |
| 0.03 | 100->100->58->10 | 100->100->66->30 | 100->100->67->27 | 100->100->67->18 | 100->100->67->15 |
| 0.05 | 100->77->34->5 | 100->94->40->18 | 100->96->40->15 | 100->97->40->10 | 100->97->40->8 |
| 0.1 | 100->39->17->2 | 100->48->20->9 | 100->50->20->8 | 100->52->20->5 | 100->52->20->4 |
| 0.2 | 100->19->8->1 | 100->24->10->5 | 100->25->10->4 | 100->26->10->3 | 100->26->10->2 |
| 0.4 | 100->10->4->1 | 100->12->5->3 | 100->12->5->2 | 100->13->5->1 | 100->13->5->1 |
| 0.495 | 100->8->3->1 | ||||
| 0.5 | - | 100->10->4->1 | 100->10->4->1 | 100->10->4->1 | 100->10->4->1 |
| 0.6 | - | 100->8->3->1 | 100->8->3->1 | 100->8->3->1 | 100->8->3->1 |
| 0.7 | - | 100->7->3->1 | 100->7->3->1 | 100->8->3->1 | 100->8->3->1 |
Search Q7 for max MeV Transmission
Find Q7 current so transmission max is like experiment (3 meV)
| Q7 Current | dE/E | 1 MeV | 2 MeV | 3 MeV | 4 MeV | 5 MeV |
| 0 A | 0.01 | 100->100->100->28 | 100->100->100->90 | 100->100->100->78 | 100->100->100->54 | 100->100->100->44 |
| 0.5 A | 0.01 | 100->100->100->51 | 100->100->100->100 | 100->100->100->89 | 100->100->100->59 | 100->100->100->47 |
| 1 A | 0.01 | 100->100->100->100 | 100->100->100->100 | 100->100->100->99 | 100->100->100->65 | 100->100->100->51 |
| 2 A | 0.01 | 100->100->100->41 | 100->100->100->100 | 100->100->100->100 | 100->100->100->82 | 100->100->100->61 |
| Q7 Current | dE/E | 1 MeV | 2 MeV | 3 MeV | 4 MeV | 5 MeV |
| 0 A | 0.03 | 100->100->58->10 | 100->100->66->30 | 100->100->67->27 | 100->100->67->18 | 100->100->67->15 |
| 1 A | 0.03 | 100->100->100->84 | 100->100->100->48 | 100->100->89->34 | 100->100->82->22 | 100->100->79->17 |
| Q7 Current | dE/E | 1 MeV | 2 MeV | 3 MeV | 4 MeV | 5 MeV |
| 0 A | 0.1 | 100->39->17->2 | 100->48->20->9 | 100->50->20->8 | 100->52->20->5 | 100->52->20->4 |
| 1 A | 0.1 | 100->39->37->27 | 100->49->32->14 | 100->50->27->10 | 100->52->25->7 | 100->52->23->5 |
| 2 A | 0.1 | 100->39->24->4 | 100->49->46->34 | 100->50->39->14 | 100->52->31->8 | 100->52->28->7 |
| 3 A | 0.1 | 100->39->12->3 | 100->49->48->48 | 100->50->47->25 | 100->52->44->10 | 100->52->35->7 |
| 4 A | 0.1 | 100->39->9->1 | 100->50->44->24 | 100->50->49->45 | 100->52->48->16 | 100->52->45->10 |
| 5 A | 0.1 | 100->39->7->1 | 100->50->27->13 | 100->51->50->46 | 100->52->49->34 | 100->52->49->14 |
| 6 A | 0.1 | 100->39->5->1 | 100->50->19->10 | 100->52->48->27 | 100->52->50->50 | 100->52->49->23 |
| Q7 Current | dE/E | 1 MeV | 2 MeV | 3 MeV | 4 MeV | 5 MeV |
| 0 A | 0.2 | 100->19->8->1 | 100->24->10->5 | 100->25->10->4 | 100->26->10->3 | 100->26->10->2 |
| 1 A | 0.2 | 100->19->19->14 | 100->25->16->7 | 100->25->14->5 | 100->26->12->3 | 100->26->12->3 |
| 2 A | 0.2 | 100->19->12->2 | 100->25->23->17 | 100->25->20->7 | 100->26->16->4 | 100->26->14->3 |
| 3 A | 0.2 | 100->19->6->2 | 100->25->24->24 | 100->25->23->13 | 100->26->22->5 | 100->26->18->3 |
| 4 A | 0.2 | 100->19->4->0 | 100->25->22->12 | 100->25->23->23 | 100->26->24->8 | 100->26->22->5 |
| 5 A | 0.2 | 100->19->4->0 | 100->25->14->7 | 100->26->25->23 | 100->26->25->17 | 100->26->25->7 |
| 6 A | 0.2 | 100->19->2->0 | 100->25->9->5 | 100->26->24->14 | 100->26->25->25 | 100->26->25->12 |
X' effect on transmission
Set dE/E = 0 and change x-prime
Q7 Current=0
| X'(rad) | 1 MeV | 2 MeV | 3 MeV | 4 MeV | 5 MeV |
| 0.001 | 100->100->100->96 | 100->100->100->100 | 100->100->100->100 | 100->100->100->100 | 100->100->100->100 |
| 0.003 | 100->100->100->60 | 100->100->100-> 88 | 100->100->100->99 | 100->100->100->98 | 100->100->100->98 |
| 0.005 | 100->94->94->39 | 100->94->92-> 67 | 100->94->92->87 | 100->95->91->84 | 100->95->91->84 |
| 0.01 | 93->69->69->21 | 91->67->64-> 36 | 91->68->64->59 | 91->68->62->54 | 91->66->61->50 |
| 0.03 | 41->25->25->8 | 41->24->22-> 12 | 43->25->24->20 | 43->25->22->19 | 41->24->21->18 |
| 0.05 | 27->16->16->5 | 26->15->14-> 8 | 27->18->16->14 | 26->16->14->11 | 24->13->12->9 |
Q7 is at 10 A
| dE/E | 1 MeV | 2 MeV | 3 MeV | 4 MeV | 5 MeV |
| 0 | 100->100->100->0 | 100->100->100->100 | 100->100->100->100 | 100->100->100->100 | 100->100->100->100 |
| 0.001 | 100->100->100->7 | 100->100->100->100 | 100->100->100->100 | 100->100->100->100 | 100->100->100->100 |
| 0.003 | 100->100->86->24 | 100->100->100->87 | 100->100->100->100 | 100->100->100->100 | 100->100->100->100 |
| 0.005 | 100->100->72->15 | 100->100->100->72 | 100->100->100->95 | 100->100->100->100 | 100->100->100->100 |
| 0.01 | 100->100->37->7 | 100->100->85->45 | 100->100->100->73 | 100->100->100->76 | 100->100->100->95 |
| 0.03 | 100->100->12->2 | 100->100->31->15 | 100->100->58->26 | 100->100->92->32 | 100->100->100->55 |
| 0.05 | 100->79->8->2 | 100->95->18->9 | 100->96->35->15 | 100->97->64->20 | 100->97->94->33 |
| 0.1 | 100->39->4->1 | 100->50->9->5 | 100->51->18->8 | 100->52->32->10 | 100->52->49->17 |
| 0.2 | 100->19->2->0 | 100->25->4->2 | 100->26->9->4 | 100->26->16->5 | 100->26->24->9 |
| 0.4 | 100->10->1->0 | 100->12->2->1 | 100->13->4->2 | 100->13->8->2 | 100->13->12->5 |
S3: transmission efficiency
Q7 effects on transmission efficiency
287,187,580 e+ started on the entrance of D1.
287,187,580 e+ ->DD1UP->D45->DD2DN->DT2UP
| Q7 | 1 MeV | 2 MeV | 3 MeV | 4 MeV | 5 MeV |
| 3.5 A | 1.397606e+8 ->372,799->14,023->211 | 1.397651e+8 ->2,565,113 ->423,855 -> 15,880 | 1.396887e+8 ->5,875,882 -> 1,229,176 -> 29,033 | 1.398474e+8 -> 5,136,409-> 925,689-> 24,525 | 1.399909e+8 -> 4,829,786 -> 842527->24,270 |
| 4 A | 1.39766 e+8 -> 372,822 -> 10,489 -> 144 | 1.397609 e+8 -> 2,562,350 -> 376,893 -> 11,395 | 1.396925 e+8 -> 5,878,246 -> 1,236,380 -> 28,788 | 1.398244 e+8 -> 5,134,603 -> 943,772 -> 24,351 | 1.399884 e+8 -> 4,831,365 -> 862,823 -> 21,619 |
| 4.5 A | 1.397694e+8 ->371,717->8,133->122 | 1.397624e+8 ->2,568,162->328,002->8,340 | 1.396864e+8 ->5,879,573->1,215,941->28060 | 1.39825e+8 ->5,133,561->955,976->23,687 | 1.399705e+8 ->4,835,046->877,511->21,117 |
| 5 A | 1.397738 e+8 -> 373,758 -> 6,682 -> 102 | 1.397676 e+8 -> 2,569,453 -> 276,527 -> 6,133 | 1.396864 e+8 -> 5,880,665 -> 1,160,296 -> 26,523 | 1.398232 e+8 -> 5,134,971 -> 962,467 -> 23,238 | 1.399815 e+8 -> 4,837,973 -> 890,292 -> 20,894 |
| 5.5 A | 1.397576 e+8 -> 373106 -> 5635 -> 91 | 1.397755 e+8 -> 2569892 -> 231582 -> 4816 | 1.396929 e+8 -> 5882742 -> -> 25479 | 1.398403 e+8 -> 514112 -> 961255 -> 22746 | 1.399873 e+8 -> 4834026 -> 899850 -> 20798 |
511 keV photons at NaI Left and NaI Right. NaIL:NaIR.
| Q7 | 1 MeV | 2 MeV | 3 MeV | 4 MeV | 5 MeV |
| 0 A | 4:4 | 22:20 | 42:51 | 62:60 | 57:42 |
| 1 A | 2:5 | 24:26 | 53:50 | 54:50 | 61:49 |
| 2 A | 0:3 | 50:57 | 50:66 | 68:46 | 72:46 |
| 3 A | 0:0 | 38:57 | 49:54 | 70:51 | 53:26 |
| 3.5 A | 1:1 | 31:36 | 56:67 | 53:45 | 52:30 |
| 4 A | 0:0 | 25:22 | 55:83 | 67:51 | 68:49 |
| 4.5 A | 0:0 | 17:16 | 54:68 | 60:59 | 59:49 |
| 5 A | 0:0 | 19:15 | 54:63 | 59:53 | 55:44 |
| 5.5 A | 1:1 | 16:12 | 51:66 | 70:41 | 66:39 |
| 10 A | 0:0 | 14:4 | 20:15 | 57:34 | 68:39 |
| 15 A | 1:1 | 9:1 | 17:7 | 34:7 | 48:39 |
| 20 A | 1:1 | 5:5 | 23:6 | 29:9 | 39:13 |
| A | : | : | : | : | : |
Normalized
| Q7 | 1 MeV | 2 MeV | 3 MeV | 4 MeV | 5 MeV |
| 3.5 A | 0.007268 | 0.546964 | 1 | 0.844728 | 0.835945 |
| 4 A | 0.005002 | 0.395825 | 1 | 0.845873 | 0.750973 |
| 4.5 A | 0.004348 | 0.297220 | 1 | 0.844155 | 0.752566 |
| 5 A | 0.003846 | 0.231233 | 1 | 0.876145 | 0.787769 |
| 5.5 A | 0.003572 | 0.189018 | 1 | 0.892735 | 0.816280 |
e+ Annihilation Efficiency
S5 test 1
(100,000 e+ shot)->(photons on NaI Left):(photons on NaI Right)-> (e+ at DT2ND)
dispersion=10/1000 sigX=0.1 sigY=0.1 sigXp=0 sigYp=0 XP=0 YP=0
| Runs | 1 MeV | 2 MeV | 3 MeV | 4 MeV | 5 MeV |
| 1 | 100000->6581:10135->575 | 100000->6841:10575->577 | 100000->7891:11389->636 | 100000->8849:12159->640 | 100000->10191:12699->647 |
| 1 | 1000->66:101->5.75 | 1000->68:106->5.77 | 1000->79:114->6.36 | 1000->89:122->6.4 | 1000->102:127->6.47 |
| Runs | 1 MeV | 2 MeV | 3 MeV | 4 MeV | 5 MeV |
| 1 | 6581:10135 | 6841:10575 | 7891:11389 | 8849:12159 | 10191:12699 |
| NaI Right | 0.79809 | 0.83274 | 0.89684 | 0.95745 | 1 |
| NaI Left | 0.64577 | 0.67128 | 0.77431 | 0.86832 | 1 |
S5 test 2
dispersion=0/1000 sigX=0 sigY=0 sigXp=0 sigYp=0 XP=0 YP=0
| Runs | 1 MeV | 2 MeV | 3 MeV | 4 MeV | 5 MeV |
| 2 | 100000->6567:10164->572 | 100000->7014:10575->536 | 100000->7752:11162->601 | 100000->8984:11995-> 630 | 100000->10018:12518->677 |
| 2 | 1000->65.77:101.64->5.72 | 1000->70.14:105.75->5.36 | 1000->77.52:111.62->6.01 | 1000->89.84:119.95-> 6.30 | 1000->100.18:125.18->6.77 |
Which Q7 Current to Chose
Ratio of Positron Rate to Electron Rata
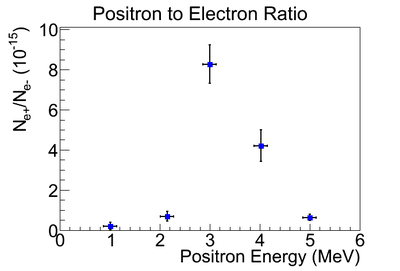
The measured ratio of positron to electron ratio is given the following table and figure.
| Energy (MeV) | Positron to Electron Ratio | Normalize to the peak |
| 1 | 0.02289 | |
| 2 | 0.08313 | |
| 3 | 1 | |
| 4 | 0.50602 | |
| 5 | 0.07470 |
Compounding Q7 and Annihilation Efficiency
| Q7 | 1 MeV | 2 MeV | 3 MeV | 4 MeV | 5 MeV |
| 3.5 A | 0.007268 | 0.546964 | 1 | 0.844728 | 0.835945 |
| 4 A | 0.005002 | 0.395825 | 1 | 0.845873 | 0.750973 |
| 4.5 A | 0.004348 | 0.297220 | 1 | 0.844155 | 0.752566 |
| 5 A | 0.003846 | 0.231233 | 1 | 0.876145 | 0.787769 |
| 5.5 A | 0.003572 | 0.189018 | 1 | 0.892735 | 0.816280 |
| Runs | 1 MeV | 2 MeV | 3 MeV | 4 MeV | 5 MeV |
| NaI Left | 0.64577 | 0.67128 | 0.77431 | 0.86832 | 1 |
| Q7 | 1 MeV | 2 MeV | 3 MeV | 4 MeV | 5 MeV |
| 3.5 A | 0.007268*0.64577 | 0.546964*0.67128 | 1*0.77431 | 0.844728*0.86832 | 0.835945*1 |
| 4 A | 0.005002*0.64577 | 0.395825*0.67128 | 1*0.77431 | 0.845873*0.86832 | 0.750973*1 |
| 4.5 A | 0.004348*0.64577 | 0.297220*0.67128 | 1*0.77431 | 0.844155*0.86832 | 0.752566*1 |
| 5 A | 0.003846*0.64577 | 0.231233*0.67128 | 1*0.77431 | 0.876145*0.86832 | 0.787769*1 |
| 5.5 A | 0.003572*0.64577 | 0.189018*0.67128 | 1*0.77431 | 0.892735*0.86832 | 0.816280*1 |
| Q7 | 1 MeV | 2 MeV | 3 MeV | 4 MeV | 5 MeV |
| 3.5 A | 0.004693 | 0.367166 | 0.77431 | 0.733494 | 0.835945 |
| 4 A | 0.003230 | 0.265709 | 0.77431 | 0.734488 | 0.750973 |
| 4.5 A | 0.002808 | 0.199518 | 0.77431 | 0.732997 | 0.752566 |
| 5 A | 0.002484 | 0.199518 | 0.77431 | 0.760774 | 0.787769 |
| 5.5 A | 0.002307 | 0.126884 | 0.77431 | 0.775180 | 0.816280 |
Require Same Event Number
| Energy (MeV) | Positron to Electron Ratio | Normalize to the peak |
| 1 | 0.02289 | |
| 2 | 0.08313 | |
| 3 | 1 | |
| 4 | 0.50602 | |
| 5 | 0.07470 |
| Q7 | 1 MeV | 2 MeV | 3 MeV | 4 MeV | 5 MeV |
| 3.5 A | 3 | 458 | 752 | 628 | 485 |
| 3.5 A | 0.004 | 0.61 | 1 | 0.83 | 0.64 |
| Q7 | 1 MeV | 2 MeV | 3 MeV | 4 MeV | 5 MeV |
| 0 A | 19 | 233 | 483 | 484 | 474 |
| 0 A | 0.04 | 0.48 | 1 | 1 | 0.98 |
| Q7 | 1 MeV | 2 MeV | 3 MeV | 4 MeV | 5 MeV |
| 10 A | 0 | 34 | 197 | 400 | 436 |
| 10 A | 0 | 0.08 | 0.45 | 0.92 | 1 |
| Q7 | 1 MeV | 2 MeV | 3 MeV | 4 MeV | 5 MeV |
| 5 A | 3 | 155 | 695 | 545 | 502 |
| 5 A | 0.004 | 0.22 | 1 | 0.78 | 0.72 |
| Q7 | 1 MeV | 2 MeV | 3 MeV | 4 MeV | 5 MeV |
| 5 A | 1 | 66 | 508 | 555 | 489 |
| 5 A | 0.002 | 0.12 | 0.92 | 1 | 0.88 |
overlay positron energy distribution at T1 with what is seen at T2 for several values of Q7
Efficiency
NaI Efficiency
Detector Efficiency: Media:SAINT-GOBAIN_3M33_Efficiency.PDF
Detector Efficiency: Media:SAINT-GOBAIN_Efficiency.PDF
At 511 keV, NaI crystals has 68% efficiency. If they are in coincidence, their efficiency is 68% * 68% =46.24%.
Siumlated results
s1: 13,799,743,800 e- (z=-260 mm) ---> 10951790 e+ Detected at DDNT1 (z=970 mm).
s2: 21,903,478,000 e+ at DDNT1 --> 5464220 e+ detected at DD1 (entrance of D1.)
s3: 14,359,380,000 e+ at DD1 --> 511 gamma detected on (NaIR && NaIL) table below
This is to say whole simulation started with 13,799,743,800*(21,903,478,000/10,951,790)*(14,359,380,000/5,464,220) = 7.2528135e+16 electrons.
| step | generated particle | detected | x times more e+ generated than previous step | ||
| s1 | 13,799,743,800 e- | 10,951,790 e+ @ DDNT1 | 62,780 e+ @ DQ4 and 6742 e+ @ DD1 | ||
| s2 | 21,903,478,000 e+ @ DDNT1 | 5,464,220 e+ @ DD1 | 143,039,300 e+ @ DQ4 | 21,903,478,000/10,951,790 = 1999.99068645 | |
| s3 | 14,359,380,000 e+ @ DD1 | e+ @ DT2DN | 14,359,380,000/5,464,220 = 2627.89199556 | ||
| s2*s3 | (21,903,478,000/10,951,790)*(14,359,380,000/5,464,220) = 5255759.51613 |
DDNT1:21,903,478,000*14,359,380,000/5,464,220 ->DQ4:143,039,300*14,359,380,000/5,464,220 -> DD1:14,359,380,000
DDNT1:57,559,974,511,209.3->DQ4:375,891,831,521 ->DD1:14,359,380,000
| Q7 = 3.5 A | 1.015 MeV | 1.5 MeV | 2.15 MeV | 2.5 MeV | 3 MeV | 3.5 MeV | 4.02 MeV | 4.5 MeV | 5 MeV | 5.5 MeV |
| NaIR && NaIL | 13 | 114 | 1032 | 1118 | 1054 | 1025 | 1020 | 961 | 848 | 765 |
| NaIR && NaIL,B_D2*0.95 | 3 | 33 | 48 | 132 | 397 | 411 | 483 | 430 | 426 | 360 |
| NaIR && NaIL,B_D2*1.05 | 6 | 219 | 192 | 483 | 666 | 658 | 638 | 540 | 600 | 520 |
| NaIR && NaIL,B_D2*1.05 | 2 | 30 | 64 | 290 | 464 | 503 | 497 | 462 | 448 | 463 |
| Q7 = 3.5 A | 1.015 MeV | 1.5 MeV | 2.15 MeV | 2.5 MeV | 3 MeV | 3.5 MeV | 4.02 MeV | 4.5 MeV | 5 MeV | 5.5 MeV |
| R | 1.7924079e-16 | 1.5718038e-15 | 1.4228961e-14 | 1.5414708e-14 | 1.4532292e-14 | 1.4132447e-14 | 1.4063508e-14 | 1.3250031e-14 | 1.1692014e-14 | 1.0547631e-14 |
| R | 0.18e-15 | 1.57-15 | 14.23e-15 | 15.41e-15 | 14.53e-15 | 14.13e-15 | 14.06e-15 | 13.25e-15 | 11.69e-15 | 10.54e-15 |
simulation after considering detector efficiency
| Q7 = 3.5 A | 1.015 MeV | 1.5 MeV | 2.15 MeV | 2.5 MeV | 3 MeV | 3.5 MeV | 4.02 MeV | 4.5 MeV | 5 MeV | 5.5 MeV |
| NaIR && NaIL | 13*46.24% | 114*46.24% | 1032*46.24% | 1118*46.24% | 1054*46.24% | 1025*46.24% | 1020*46.24% | 961*46.24% | 848*46.24% | 765*46.24% |
| NaIR && NaIL,B_D2*0.95 | 3*46.24% | 33*46.24% | 48*46.24% | 132*46.24% | 397*46.24% | 411*46.24% | 483*46.24% | 430*46.24% | 426*46.24% | 360*46.24% |
| NaIR && NaIL,B_D2*1.05 | 6*46.24% | 219*46.24% | 192*46.24% | 483*46.24% | 666*46.24% | 658*46.24% | 638*46.24% | 540*46.24% | 600*46.24% | 520*46.24% |
 Q7 = 3.5 A                || 1.015 MeV || 1.5 MeV  || 2.15 MeV || 2.5 MeV || 3 MeV    || 3.5 MeV  || 4.02 MeV || 4.5 MeV || 5 MeV    ||  5.5 MeV
 NaIR && NaIL              || 6.0112    || 52.7136  || 477.1968 || 516.9632|| 487.3696 || 473.96   || 471.648  || 444.3664|| 392.1152 ||  353.736
 NaIR && NaIL,B_D2*0.95    || 1.3872    || 15.2592  || 22.1952  || 61.0368 || 183.5728 || 190.0464 || 223.3392 || 198.832 || 196.9824 ||  166.464
 NaIR && NaIL,B_D2*1.05    || 2.7744    || 101.2656 || 88.7808  || 223.3392|| 307.9584 || 304.2592 || 295.0112 || 249.696 || 277.44   ||  240.448
Transmission Efficiency to DUPT2
Bin width is 0.5 MeV. For example for 2.15, the bin is 1.85~2.35.
| Detector | 1.015 MeV | 1.5 MeV | 2.15 MeV | 2.5 MeV | 3 MeV | 3.5 MeV | 4.02 MeV | 4.5 MeV | 5 MeV | 5.5 MeV |
| Detector | 0.765~1.265 MeV | 1.25~1.75 MeV | 1.85~2.35 MeV | 2.25~2.75 MeV | 2.75~3.25 MeV | 3.25~3.75 MeV | 3.77~4.27 MeV | 4.25~4.75 MeV | 4.75~5.25 MeV | 5.25~5.75 MeV |
| DT2UP (s3) | 10707 | 140228 | 958080 | 1190199 | 1196043 | 1193796 | 1159452 | 1095487 | 1010286 | 906707 |
| DDNT1 (s1) should be multiplyed *(21903478000/10951790)*(14359380000/5464220) | 481565 | 936192 | 1232531 | 1294501 | 1262790 | 1163914 | 1016908 | 871468 | 717717 | 573574 |
| DQ4 (s2) should be multiplyed *(14359380000/5464220) | 5195306 | 10459770 | 14297460 | 15433380 | 15490470 | 14792460 | 13346730 | 11796010 | 10101670 | 8394400 |
| DD1 (s2) should be multiplyed *(14359380000/5464220) | 520593 | 1050496 | 1435086 | 1549003 | 1555254 | 1484034 | 1340350 | 1183247 | 1015548 | 842818 |
| Detector | 1.015 MeV | 1.5 MeV | 2.15 MeV | 2.5 MeV | 3 MeV | 3.5 MeV | 4.02 MeV | 4.5 MeV | 5 MeV | 5.5 MeV |
| Detector | 0.765~1.265 MeV | 1.25~1.75 MeV | 1.85~2.35 MeV | 2.25~2.75 MeV | 2.75~3.25 MeV | 3.25~3.75 MeV | 3.77~4.27 MeV | 4.25~4.75 MeV | 4.75~5.25 MeV | 5.25~5.75 MeV |
| DT2UP (s3) | 10707 | 140228 | 958080 | 1190199 | 1196043 | 1193796 | 1159452 | 1095487 | 1010286 | 906707 |
| DDNT1 (s1) | 481565 | 936192 | 1232531 | 1294501 | 1262790 | 1163914 | 1016908 | 871468 | 717717 | 573574 |
| DQ4 (s2) | 5195306 | 10459770 | 14297460 | 15433380 | 15490470 | 14792460 | 13346730 | 11796010 | 10101670 | 8394400 |
| DD1 (s2) | 520593 | 1050496 | 1435086 | 1549003 | 1555254 | 1484034 | 1340350 | 1183247 | 1015548 | 842818 |
| NaIR && NaIL | 13 | 114 | 1032 | 1118 | 1054 | 1025 | 1020 | 961 | 848 | 765 |
New Run result
| Detector | 1.015 MeV | 1.5 MeV | 2.15 MeV | 2.5 MeV | 3 MeV | 3.5 MeV | 4.02 MeV | 4.5 MeV | 5 MeV | 5.5 MeV |
| Detector | 0.765~1.265 MeV | 1.25~1.75 MeV | 1.85~2.35 MeV | 2.25~2.75 MeV | 2.75~3.25 MeV | 3.25~3.75 MeV | 3.77~4.27 MeV | 4.25~4.75 MeV | 4.75~5.25 MeV | 5.25~5.75 MeV |
| NaIR && NaIL | 12 | 168 | 1261 | 1237 | 1247 | 1222 | 1220 | 1147 | 1003 | 907 |
back tracking
Ratio - Positrons reaches T2 to Positrons Detected
The ratio of positrons reaches end of the beamline to the one being detected by NaI detectors in coincidence mode.
| Detector | 1.015 MeV | 1.5 MeV | 2.15 MeV | 2.5 MeV | 3 MeV | 3.5 MeV | 4.02 MeV | 4.5 MeV | 5 MeV | 5.5 MeV |
| Detector | 0.765~1.265 MeV | 1.25~1.75 MeV | 1.85~2.35 MeV | 2.25~2.75 MeV | 2.75~3.25 MeV | 3.25~3.75 MeV | 3.77~4.27 MeV | 4.25~4.75 MeV | 4.75~5.25 MeV | 5.25~5.75 MeV |
| DT2UP (s3) | 10707 | 140228 | 958080 | 1190199 | 1196043 | 1193796 | 1159452 | 1095487 | 1010286 | 906707 |
| NaIR && NaIL | 13 | 114 | 1032 | 1118 | 1054 | 1025 | 1020 | 961 | 848 | 765 |
| (DT2UP)/(NaIR && NaIL) | 3569 | 1230.07017544 | 928.372093023 | 1064.57871199 | 1134.76565465 | 1164.67902439 | 1136.71764706 | 1139.94484912 | 1191.375 | 1185.2379085 |
| (DT2UP)/(NaIR && NaIL) | 3569 | 1230 | 928 | 1065 | 1135 | 1165 | 1137 | 1140 | 1191 | 1185 |
| Include Detector efficiency (DT2UP)/(NaIR && NaIL) | 7718.42560554 | 2660.18636557 | 2007.72511467 | 2454.07797286 | 2454.07797286 | 2518.76951641 | 2458.29940973 | 2465.27865294 | 2576.50302768 | 2563.23077098 |
| Include Detector efficiency (DT2UP)/(NaIR && NaIL) | 7718 | 2660 | 2008 | 2454 | 2454 | 2519 | 2458 | 2465 | 2577 | 2563 |
Ratio of Positron Rate to Electron Rata
The measured ratio of positron to electron ratio is given the following table and figure.
| Energy (MeV) | Positron to Electron Ratio |
| 1 | |
| 2 | |
| 3 | |
| 4 | |
| 5 |
Estimation
In Run 3735, 100 mA peak current, 300 Hz reprate, 300 ns macro pulse length. positron Rate Detected on NaI detectors are 0.26 for 3 MeV. That means positron rate (reaches T2 location) is 638 per second.
electrons per second on HRRL.
Then we have positrons with rate reaches T2 area of beamline
| Energy (MeV) | Positron to Electron Ratio |
| 1 | |
| 2 | |
| 3 | |
| 4 | |
| 5 |
Simulation Error
Max = B+Delta_B, Max = B-Delta_B.
D1     Q7             D2
Max    3.5            Max
Min    3.5            Min
Max    3.5            default
Min    3.5            default
Max    3.5+Delta_I    default
Max    3.5-Delta_I    default
Min    3.5+Delta_I    default
Min    3.5-Delta_I    default
Delta_I=0.1 Amp.
| Detector | Magnet Settings | 1.015 MeV | 1.5 MeV | 2.15 MeV | 2.5 MeV | 3 MeV | 3.5 MeV | 4.02 MeV | 4.5 MeV | 5 MeV | 5.5 MeV |
| Detector | 0.765~1.265 MeV | 1.25~1.75 MeV | 1.85~2.35 MeV | 2.25~2.75 MeV | 2.75~3.25 MeV | 3.25~3.75 MeV | 3.77~4.27 MeV | 4.25~4.75 MeV | 4.75~5.25 MeV | 5.25~5.75 MeV | |
| NaIR && NaIL | D1=Max,Q7=3.5,D2=Max. | 27 | 205 | 1457 | 1689 | 1599 | 1541 | 1493 | 1355 | 1206 | 1110 |
| NaIR && NaIL | D1=Min,Q7=3.5,D2=Min. | ||||||||||
| NaIR && NaIL | D1=Max,Q7=3.5,D2=Default. | ||||||||||
| NaIR && NaIL | D1=Min,Q7=3.5,D2=Default. | ||||||||||
| NaIR && NaIL | D1=Max,Q7=3.5+Delta_I,D2=Default. | ||||||||||
| NaIR && NaIL | D1=Max,Q7=3.5-Delta_I,D2=Default. | ||||||||||
| NaIR && NaIL | D1=Min,Q7=3.5-Delta_I,D2=Default. | ||||||||||
| NaIR && NaIL | D1=Min,Q7=3.5+Delta_I,D2=Default. | ||||||||||
| NaIR && NaIL | D1=Default,Q7=3.5,D2=Default. | 14 | 209 | 1588 | 1717 | 1563 | 1549 | 1517 | 1396 | 1223 | 1153 |
| NaIR && NaIL | D1=Default,Q7=10,D2=Default. | 3 | 19 | 117 | 226 | 420 | 678 | 842 | 970 | 842 | 699 |
| NaIR && NaIL | D1=Default,Q7= 0,D2=Default. | 34 | 252 | 724 | 889 | 1032 | 1121 | 1221 | 1185 | 1128 | 1067 |
Positron to Electron Ratio Prediction by Simulation
Simulation started with 13,799,743,800*(21,903,478,000/10,951,790)*(14,359,380,000/5,464,220) = 7.2528135e+16 electrons. Detected positrons are
| Detector | Magnet Settings | 1.015 MeV | 1.5 MeV | 2.15 MeV | 2.5 MeV | 3 MeV | 3.5 MeV | 4.02 MeV | 4.5 MeV | 5 MeV | 5.5 MeV |
| Detector | 0.765~1.265 MeV | 1.25~1.75 MeV | 1.85~2.35 MeV | 2.25~2.75 MeV | 2.75~3.25 MeV | 3.25~3.75 MeV | 3.77~4.27 MeV | 4.25~4.75 MeV | 4.75~5.25 MeV | 5.25~5.75 MeV | |
| NaIR && NaIL | D1=Default,Q7=3.5,D2=Default. | 14*46.24% | 209*46.24% | 1588*46.24% | 1717*46.24% | 1563*46.24% | 1549*46.24% | 1517*46.24% | 1396*46.24% | 1223*46.24% | 1153*46.24% |
| NaIR && NaIL | D1=Default,Q7=3.5,D2=Default. | 6.4736 | 96.6416 | 734.2912 | 793.9408 | 722.7312 | 716.2576 | 701.4608 | 645.5104 | 565.5152 | 533.1472 |
Positron to Electron Ratio Prediction by Simulation is:
| Detector | Magnet Settings | 1.015 MeV | 1.5 MeV | 2.15 MeV | 2.5 MeV | 3 MeV | 3.5 MeV | 4.02 MeV | 4.5 MeV | 5 MeV | 5.5 MeV |
| Detector | 0.765~1.265 MeV | 1.25~1.75 MeV | 1.85~2.35 MeV | 2.25~2.75 MeV | 2.75~3.25 MeV | 3.25~3.75 MeV | 3.77~4.27 MeV | 4.25~4.75 MeV | 4.75~5.25 MeV | 5.25~5.75 MeV | |
| NaIR && NaIL | D1=Default,Q7=3.5,D2=Default. | 14*46.24% | 209*46.24% | 1588*46.24% | 1717*46.24% | 1563*46.24% | 1549*46.24% | 1517*46.24% | 1396*46.24% | 1223*46.24% | 1153*46.24% |
| NaIR && NaIL | D1=Default,Q7=3.5,D2=Default. | 6.4736 | 96.6416 | 734.2912 | 793.9408 | 722.7312 | 716.2576 | 701.4608 | 645.5104 | 565.5152 | 533.1472 |
Wrong NaI Size
| Detector | Magnet Settings | 1.015 MeV | 1.5 MeV | 2.15 MeV | 2.5 MeV | 3 MeV | 3.5 MeV | 4.02 MeV | 4.5 MeV | 5 MeV | 5.5 MeV |
| Detector | 0.765~1.265 MeV | 1.25~1.75 MeV | 1.85~2.35 MeV | 2.25~2.75 MeV | 2.75~3.25 MeV | 3.25~3.75 MeV | 3.77~4.27 MeV | 4.25~4.75 MeV | 4.75~5.25 MeV | 5.25~5.75 MeV | |
| NaIR && NaIL | D1=Max,Q7=3.5,D2=Max. | 25 | 169 | 1277 | 1373 | 1291 | 1251 | 1215 | 1135 | 1014 | 934 |
| NaIR && NaIL | D1=Min,Q7=3.5,D2=Min. | 12 | 156 | 1255 | 1320 | 1306 | 1271 | 1061 | 1118 | 1031 | 915 |
| NaIR && NaIL | D1=Max,Q7=3.5,D2=Default. | 1 | 156 | 1257 | 1312 | 1308 | 1268 | 1223 | 1130 | 1042 | 923 |
| NaIR && NaIL | D1=Min,Q7=3.5,D2=Default. | 6 | 166 | 1245 | 1302 | 1283 | 1273 | 1218 | 1125 | 1003 | 875 |
| NaIR && NaIL | D1=Max,Q7=3.5+Delta_I,D2=Default. | 1 | 143 | 1158 | 1333 | 1268 | 1244 | 1197 | 1098 | 983 | 903 |
| NaIR && NaIL | D1=Max,Q7=3.5-Delta_I,D2=Default. | 1 | 190 | 1363 | 1321 | 1366 | 1257 | 1220 | 1135 | 1026 | 913 |
| NaIR && NaIL | D1=Min,Q7=3.5-Delta_I,D2=Default. | 2 | 163 | 1272 | 1332 | 1274 | 1195 | 1208 | 1112 | 975 | 927 |
| NaIR && NaIL | D1=Min,Q7=3.5+Delta_I,D2=Default. | 5 | 130 | 1156 | 1351 | 1240 | 1197 | 1190 | 1106 | 1008 | 904 |
| NaIR && NaIL | D1=Default,Q7=3.5,D2=Default. | 12 | 168 | 1261 | 1237 | 1247 | 1222 | 1220 | 1147 | 1003 | 907 |
After considering detector efficiency 46.24%.
1.015MeV 	1.5 MeV 	2.15 MeV        2.5 MeV         3 MeV           3.5 MeV         4.02 MeV        4.5 MeV         5 MeV   	5.5 MeV
11.56		78.1456		590.4848	634.8752	596.9584	578.4624	561.816	        524.824	        468.8736	431.8816
5.5488		72.1344		580.312	        610.368	        603.8944	587.7104	490.6064	516.9632	476.7344	423.096
0.4624		72.1344		581.2368	606.6688	604.8192	586.3232	565.5152	522.512	        481.8208	426.7952
2.7744		76.7584		575.688	        602.0448	593.2592	588.6352	563.2032	520.2	        463.7872	404.6
0.4624		66.1232		535.4592	616.3792	586.3232	575.2256	553.4928	507.7152	454.5392	417.5472
0.4624		87.856		630.2512	610.8304	631.6384	581.2368	564.128	        524.824	        474.4224	422.1712
0.9248		75.3712		588.1728	615.9168	589.0976	552.568	        558.5792	514.1888	450.84	        428.6448
2.312		60.112		534.5344	624.7024	573.376	        553.4928	550.256	        511.4144	466.0992	418.0096
5.5488		77.6832		583.0864	571.9888	576.6128	565.0528	564.128	        530.3728	463.7872	419.3968
  D1            Max Min Max Min Max Max Min Min Def
  Q7            Def Def Def Def Max Min Min Def Def
  D2            Max Min Def Def Def Def Def Def Def
Energy
0.765-1.265 MeV 12  6   1   3   5   1   1   2   6
1.25 - 1.75 MeV 78  72  72  77  66  89  75  60  78
1.85 - 2.35 MeV 591 580 581 576 535 630 588 535 583
2.25 - 2.75 MeV 635 610 607 602 616 611 616 625 572
2.75 - 3.25 MeV 597 604 605 593 586 632 589 573 577
3.25 - 3.75 MeV 579 588 586 589 575 582 553 553 565
3.77 - 4.27 MeV 562 491 566 563 553 564 559 550 564
4.25 - 4.75 MeV 525 520 523 520 508 525 514 511 530
4.75 - 5.25 MeV 469 477 482 464 455 474 451 466 464
5.25 - 5.75 MeV 432 423 427 405 418 422 429 418 419
Energy 	Energy 	Unit 		                                                               average	std    average	std
Min    Max                                                                                             dev             dev
0.77	1.27	MeV	12	6	1	3	5	1	1	2	6	4.11	3.62	4	4
1.25	1.75	MeV	78	72	72	77	66	89	75	60	78	74.11	8.18	74	8
1.85	2.35	MeV	591	580	581	576	535	630	588	535	583	577.67	28.97	578	29
2.25	2.75	MeV	635	610	607	602	616	611	616	625	572	610.44	17.46	610	17
2.75	3.25	MeV	597	604	605	593	586	632	589	573	577	595.11	17.62	595	18
3.25	3.75	MeV	579	588	586	589	575	582	553	553	565	574.44	14.21	574	14
3.77	4.27	MeV	562	491	566	563	553	564	559	550	564	552.44	23.66	552	24
4.25	4.75	MeV	525	520	523	520	508	525	514	511	530	519.56	7.23	520	7
4.75	5.25	MeV	469	477	482	464	455	474	451	466	464	466.89	9.98	467	10
5.25	5.75	MeV	432	423	427	405	418	422	429	418	419	421.44	7.92	421	8
