JB Anaysis

From New IAC Wiki
Revision as of 23:40, 14 August 2015 by Burgjeff (talk | contribs) (→‎Energy)
Jump to navigation Jump to search

DU runs

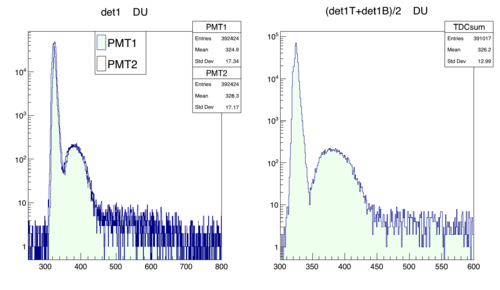
TDC spectrum

Detector 1

Det1TDC.png

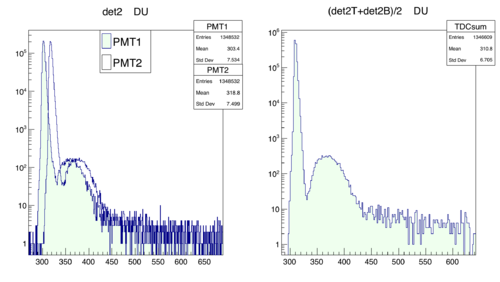
Detector 2

Det2tdc.png

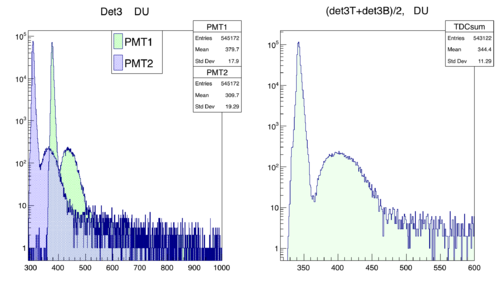
Detector 3

Det3DTC.png

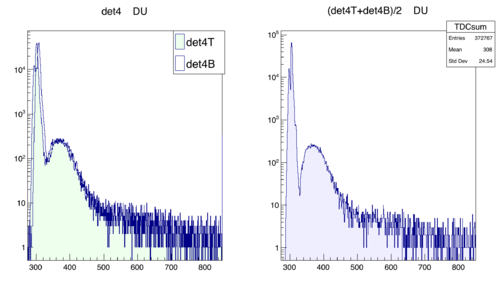
Detector 4

Det4TDc.png

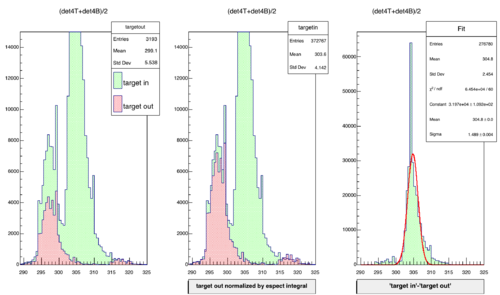
Target in vs. target out

Gamma peak is revealed by comparing target in and target out runs. (open the file to see it clearly) Det4Gammas.png
2nCor_44#Analysis

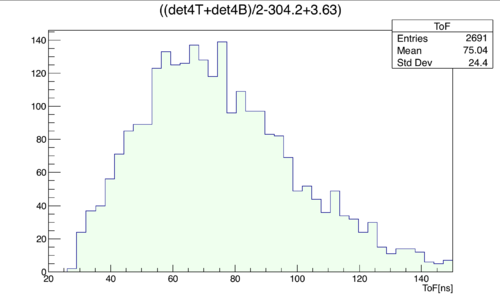
ToF

[math]Neutron TOF=\frac{PMT_{top}+PMT_{bottom}}{2}-t_{\gamma peak}+\gamma_{TOF}[/math] Det4ToF.png

Energy

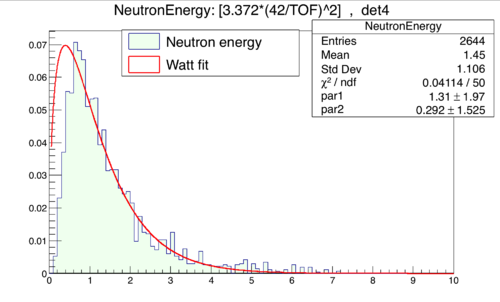
Neutron Energy: [math]\frac{1}{2}m_{n}\left(\frac{in}{ns}\right)^2=3.372\left(\frac{42}{t}\right)^2 MeV[/math]

Watt distribution: \n[math]Ce^{-aE^'}\sinh\left(\sqrt{bE^'}\right)=0.70767 e^{-0.883802 E^'}\sinh \left(\sqrt{E^'}\right)[/math]

DEt4NeutronEnergy.png

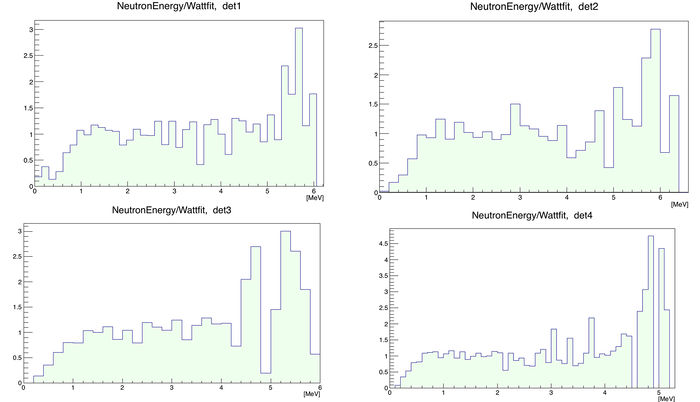
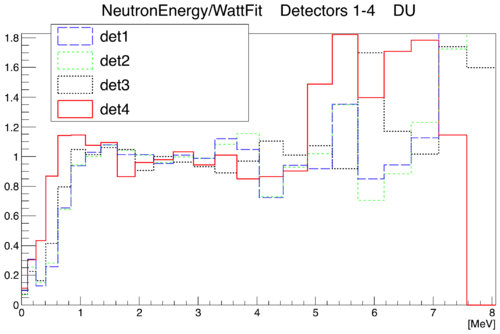
EngvsWqatt.jpg WattVsEng.png

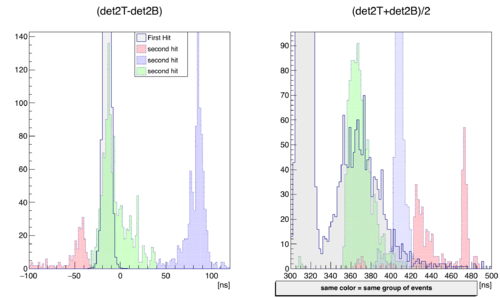
Second Hit

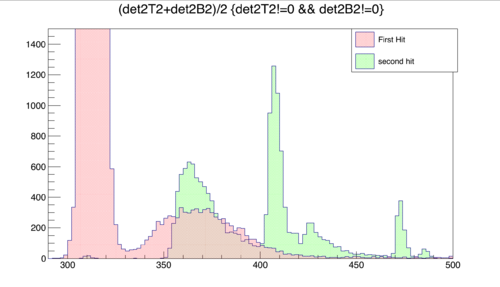
Odd TDC spectrum in the second hit:

SecondHit1.png

Applying cuts based on TDC difference could help:

SecondHit.png

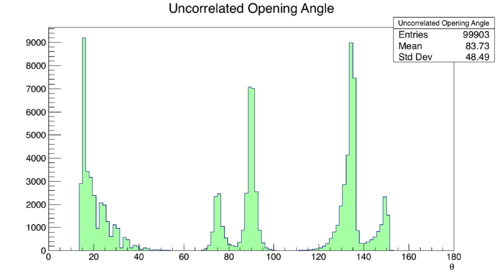
Opening angles

Uncorrelated distribution from detectors 1-4:

Snip20150729 3.png

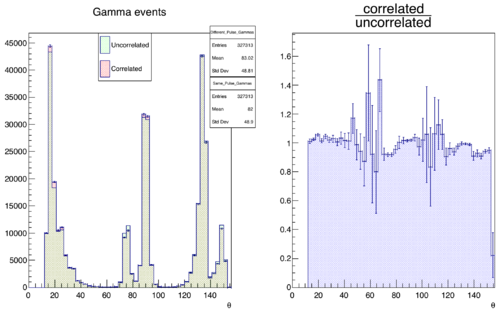
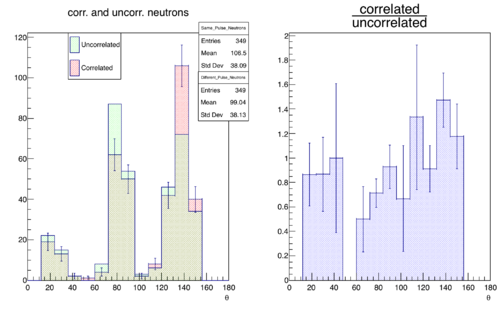
Analyzing 5653446 pulses from DU runs, I was able to find 349 two-neutron events in detectors 1-4. CorrOverUncorR.png
As a test I did the same for gamma events:
Gammacorrelation.png