Difference between revisions of "IAC data analysis for GEM"
Jump to navigation
Jump to search
| Line 9: | Line 9: | ||
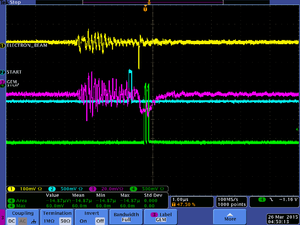
| − | The picture above shows the time frame of the pulses relative to each other. The beam gun was earliest in time, then the beam electron's signal came | + | The picture above shows the time frame of the pulses relative to each other. The beam gun RF signal was earliest in time, then the beam electron's signal came after 200 ns, and finally GEM's analog signal, with a rise time of about 200 ns, as it was in time with the TDC stop pulse that had a pulse width of about 50 ns. |
Revision as of 21:20, 28 March 2015
03/26/15
- Electronics Setup
PS-ADC, QDC and TDC were used for this experiment. The collected data for GEM was discriminated by CFD and its output was in coincidence with beam gun signal, which became an input for gate generator for QDC and PS-ADC and stop for the for the TDC. (TDC setup was in a common start and beam gun signal was the starter).
The picture above shows the time frame of the pulses relative to each other. The beam gun RF signal was earliest in time, then the beam electron's signal came after 200 ns, and finally GEM's analog signal, with a rise time of about 200 ns, as it was in time with the TDC stop pulse that had a pulse width of about 50 ns.
GO BACK [1]
