Difference between revisions of "GradFinalLab RS"
| (6 intermediate revisions by the same user not shown) | |||
| Line 86: | Line 86: | ||
and doing math and propagating errors we end up with the following predicted threshold voltages: | and doing math and propagating errors we end up with the following predicted threshold voltages: | ||
| − | + | <math>V_2(\mbox{theory}) = (6.41\pm 0.07)\ V\ \ (\mbox{if}\ \mbox{the}\ \mbox{output}\ \mbox{is}\ \mbox{high})</math> | |
| − | <math>V_2(\mbox{theory}) = ( | + | <math>V_2^'(\mbox{theory}) = (4.47\pm 0.06)\ V\ \ (\mbox{if}\ \mbox{the}\ \mbox{output}\ \mbox{is}\ \mbox{low})</math> |
| − | |||
| − | + | They are in total agreement with measured ones within the calculated error above: | |
| + | <math>V(\mbox{measured}) = (6.38\pm 0.01)\ V\ \ (\mbox{if}\ \mbox{the}\ \mbox{output}\ \mbox{is}\ \mbox{high})</math> | ||
| − | + | <math>V^'(\mbox{measured}) = (4.48\pm 0.01)\ V\ \ (\mbox{if}\ \mbox{the}\ \mbox{output}\ \mbox{is}\ \mbox{low})</math> | |
=low-frequency input= | =low-frequency input= | ||
| Line 101: | Line 101: | ||
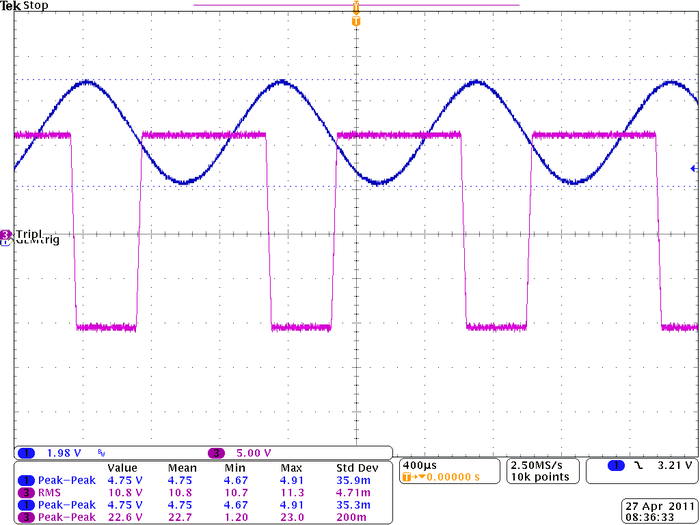
Below my digital scope picture of how the Schmitt Trigger output signal behaves with respect to low frequency input signal. | Below my digital scope picture of how the Schmitt Trigger output signal behaves with respect to low frequency input signal. | ||
| − | [[File:Tek00047.png | | + | [[File:Tek00047.png | 700px]] |
Latest revision as of 06:09, 28 April 2011
Construct a Schmitt Trigger using the 741 Op Amp
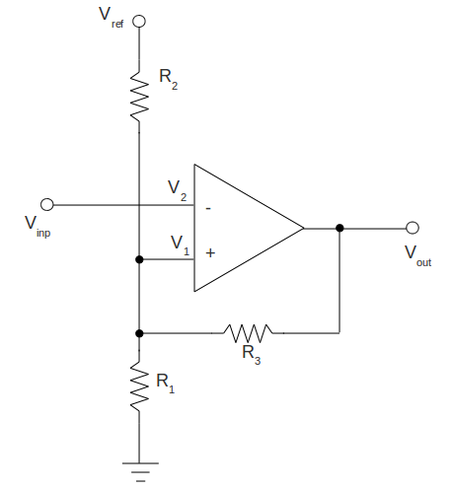
Draw the Schmitt Trigger circuit you constructed. Identify the values of all components
To construct the circuit above I am going to use the following components and voltages:
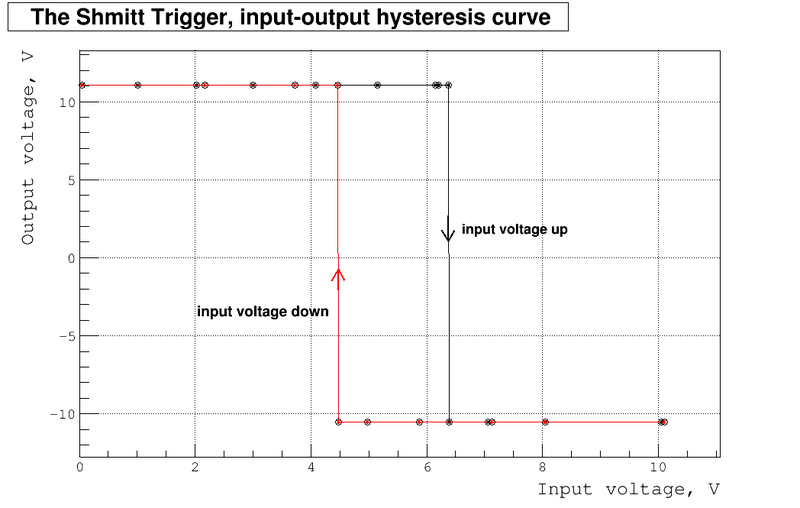
Graph as a function of . Is there a hysteresis loop?
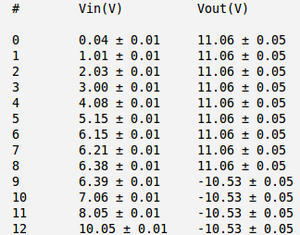
If the input voltage goes up my measured output voltages are:
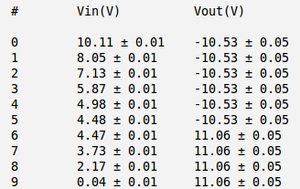
If the input voltage goes down my measured output voltages are:
In the plot below I overplay the output voltages vs. input voltages for both cases as input voltage goes up (black line) and down (red line):
As we can clearly see there is the hysteresis loop. The reason for this loop is because the threshold voltages depends from output voltage. If the output voltage is high the threshold voltage is higher than for the case if output voltage is low.
Identify the input voltage threshold levels at which a will produce
From my measurements above:
1) if the output voltage is high () my threshold voltage is:
2) if the output voltage is low () my threshold voltage is:
Compare the threshold values to what is expected.
The theory does say (ch. 10.19 The Schmitt Trigger of R. Simpson "Introductory electronics for scientists and engineers"):
1) if the output is high:
2) if the output is low:
where
and and approximately equal to supply voltage
The actual measured values of high and low output voltages (they do not really equal to ) are:
Substituting all quantities in the formulas above:
and doing math and propagating errors we end up with the following predicted threshold voltages:
They are in total agreement with measured ones within the calculated error above:
low-frequency input
Below my digital scope picture of how the Schmitt Trigger output signal behaves with respect to low frequency input signal.
As we can see it flips perfectly up and down if the input signal exceeds the calculated above threshold values.
Go Back to All Lab Reports Forest_Electronic_Instrumentation_and_Measurement
