Forest StatBadExamples
example
1.) "For example, reports that alcohol sales are soaring, because sales increased by 5% between 1999 and 2004."
The basic information is that 5% more alcohol was sold in 2004 as compared to 1999. The statement that "alcohol sales are souring" implies that there is an unusual increase in the amount of alcohol sold. This implication is not warranted by the data. Alcohol sales may have increased by 5% merely because the alcohol consuming population increase by 5% not because people are drinking more alcohol. There could be more people to drink alcohol instead of people drinking more alcohol.
example
2.) The graph below is intended to show that the average planet temperature is increasing.

More conclusive one: Media:StatisticAbuse_1a.png
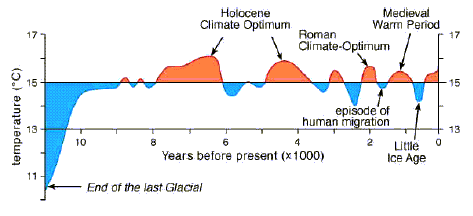
Problems with the graph.
a.) Each point does not show an uncertainty. One can assume that each points represents the average temperature for the year or at the very least the average temperature over some finite length of time less than or equal to a year. In any case that average should have an uncertainty associated with it. It is most likely that expressing the uncertainty as an error bar will result in an error bar which has lines reaching beyond the vertical scale of the graph.
b.) No statistical information of the fit. The article did not give any information to justify what appears to be a linear fit. You should always put information about the fit onto the graph.
example
3.) Based on a study conducted in a public school it was found that that 75% of delinquent students are Asian.
What would you think about that statistical report without the knowing the raw data? Majority of the Asian students are delinquent right?
Here is the raw data/information: Total student populations: 1,000 where 800 are Asian descend (Either both parent or just one is Asian) 200 are mixed (American/Hispanic) reported Delinquent Students: only 4 of which 3 are Asian descend
It's easy to be fooled by statistics if you're just given the final figure without background of the raw data, your populations, and other pertinent information to make the presentation more objective.
example
4.) Heard a commentator say something to the effect of, “No Democratic president has ever won office without carrying the state of Missouri.”
I just searched for “without winning Missouri” on Google.com. Apparently, a Democrat being elected president has always coincided with Missouri’s going Democratic (but not the other way around – Missouri has predicted a Democrat and been wrong, as several sites bemoan). Whoopee! A way to predict the winner! If a Democrat won then Missouri must have gone Democrat. But this time, it failed.
Failed indeed. This is a fine example of pure statistical hype. Good stats classes teach ways to avoid this kind of math mistake. Missouri was never a validated predictor of the Democratic wins, and the so-called “American opinion.” “What? It aligns so perfectly. How can you say that?” Even if the next 10 Democrats carry Missouri and win the presidency, it is still an invalid predictor in my book. I can’t even muster a reasonable case for real covariance.