EG1BFragmentationTestTalk
Fragmentation Test
The goal of this work is to measure the fragmentation function dependence on the Bjorken scaling variable () and the four momentum transfer squared () as well as evaluate the independence of the fractional energy of the observed final state hadron (). The fragmentation function ( ) can be expressed in terms of the ratio of the difference of polarized to unpolarized cross sections for the semi inclusive deep inelastic scattering for proton and neutron targets.
Data Files
The data files from the EG1b experiment chosen for this analysis are listed below
| Run Set | Target Type | Torus Current(A) | Target Polarization | Half Wave Plane(HWP) |
| 28100 - 28102 | ND3 | +2250 | -0.18 | +1 |
| 28106 - 28115 | ND3 | +2250 | -0.18 | -1 |
| 28145 - 28158 | ND3 | +2250 | -0.20 | +1 |
| 28166 - 28190 | ND3 | +2250 | +0.30 | +1 |
| 28205 - 28217 | NH3 | +2250 | +0.75 | +1 |
| 28222 - 28236 | NH3 | +2250 | -0.68 | +1 |
| 28242 - 28256 | NH3 | +2250 | -0.70 | -1 |
| 28260 - 28275 | NH3 | +2250 | +0.69 | -1 |
| 28287 - 28302 | ND3 | -2250 | +0.28 | +1 |
| 28306 - 28322 | ND3 | -2250 | -0.12 | +1 |
| 28375 - 28399 | ND3 | -2250 | +0.25 | -1 |
| 28407 - 28417 | NH3 | -2250 | +0.73 | -1 |
| 28456 - 28479 | NH3 | -2250 | -0.69 | +1 |
| EG1b Runs used for Analysis (Run Sets, Target Type, Torus Current, Target Polarization, HWP). |
Electron-Pion separation
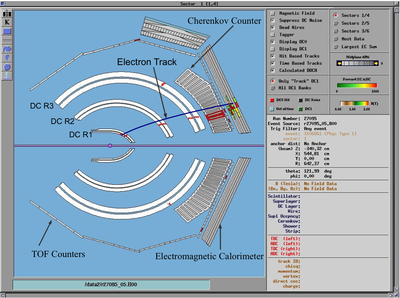
The CLAS trigger system is a coincidence of the negatively charged particle track detected in the electromagnetic calorimeter and cherenkov counter in time window. Unfortunately, a background of high energy negative pions may be misidentified as electrons. These pions are mis-identified as electrons due to quasi-real photoproduction, when the polar angle of the scattered lepton is approximately zero and is not accounted by the CLAS detector. The pion contamination of the electron sample is reduced using cuts on the energy deposited in the electromagnetic calorimeter and the momentum measured in the track reconstruction for the known magnetic field. The energy deposition mechanism for the pions and electrons in the electromagnetic calorimeter is different. The total energy deposited by the electrons in the EC is proportional to their kinetic energy, whereas pions are minimum ionizing particles and the energy deposition is independent of their momentum. The pion background is further supressed using, geometrical and time matching between the cherenkov counter hit and the measured track in the drift chamber.
EC Cuts
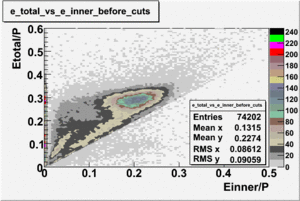
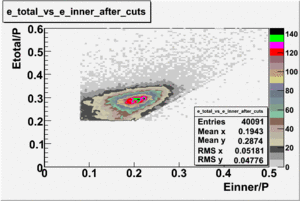
The energy deposited in the calorimeter for electrons and pions is different. Pions are minimum ionizing charged particles when their momentum is above ~ 0.8 GeV and therefore the energy they deposit in the calorimeter is momentum independent. On the other hand, electrons produce photoelectrons and generate an electromagnetic shower releasing energy into the calorimeter that is proportional to their momentum. The following cut is introduced to take advantage of this feature: . The cut was also applied to the energy collected in the inner part of the calorimeter: , because the ratio of the total energy deposited to the energy deposited in the inner calorimeter depends on the thickness of the detector and is a constant.
| vs before and after EC cuts (, for EC inner - ). After applying EC cuts about 46 % of the events have been removed from the electron sample. |
Cherenkov Cuts
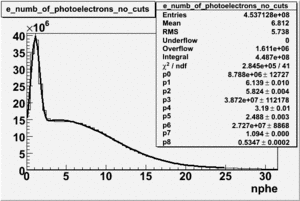
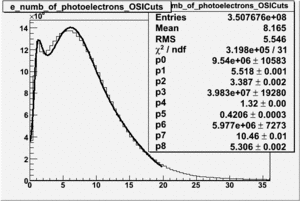
In addition to the cut on the energy deposited into the electromagnetic calorimeter, misidentified electrons are reduced by requiring a signal in the threshold CLAS Cherenkov detector. Pion's misidentified as electrons have been shown to produce around ~1.5 photoelectons (PEs) in the Cherenkov detector, as shown below. Geometrical cuts on the location of the particle at the entrance to the Cerenkov detector were applied to reduce the pion contamination. The second histogram below shows that, after these cuts, the peak around 1.5 PEs is substantially reduced. It appears, that pion contamination in electron sample is before applying the hard cut on the number of photoelectrons produced in the cherenkov counter and after cut contamination is about .
| The number of photoelectrons before and after OSI Cuts. |
