DeepBlueMarin 04222013
Irradiation of Silver coins from Deep Blue Marin performed on April 22, 2013
Large Coin
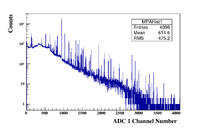
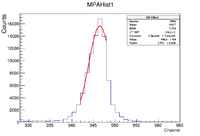
Raw Spectrum
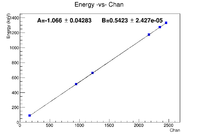
Calibration
 |
 |
|
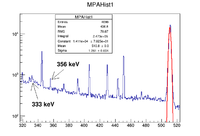
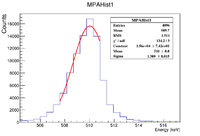
| Linear fit using several sources | Zoom in to the most intense line | The most intense line seems to be from positron annihilation |
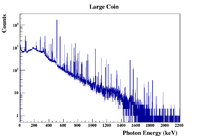
Energy Calibrated spectrum
Peak Ratios
Ratio of 511 and
- Silver lines
| Coin Size | 511/451 ratio | 511/748 ratio | 511/1046 ratio |
| Large | 87740/6639 =13.2 | 87740/2962=29.6 | 87740/2803 = 31.3 |
| Medium | 31950/2938 =10.9 | 31950/1239 =25.8 | 31950/1283=24.9 |
| Small | 87090/8184=10.6 | 87090/3790 =22.98 | 87090/3578=24.34 |
- Gold lines
Consider the neutron knock out reaction on Gold
Au-196 decays with a half life 6.183 days of by electron capture to Platinum (Pt-196) 92% of the time.
There are two dominant photon energies of 333.03 keV and 355.73 keV. 67% of the time Au-196 goes to the 2+ excited state of Pt-196 after 34.15 ps . 24.7% of the time it decays to the next higher energy 2+ state of Pt-196 after 33.8 ps and then proceeds to emitt a 333.03 keV photon as it transitions to the lower 2+ state where it will emitt a 355.73 keV photon on its way to the ground state.
The spectra below show a clear peak at a photon energy of 356 keV but the signal at 333 keV is less convincing. It looks more like
| Coin Size | 333 keV | 356 keV | 333/356 ratio |
| Large | 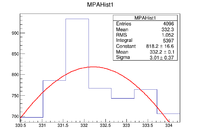 |
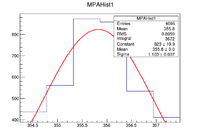 |
5397/3672=1.47 |
| Medium | 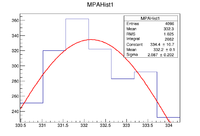 |
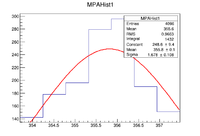 |
2062/1432=1.44 |
| Small | 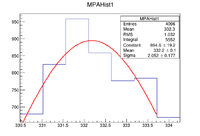 |
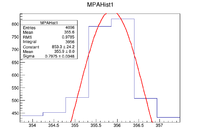 |
5552/3956 =1.40 |
