Difference between revisions of "DC hits to Moller XSection"

From New IAC Wiki
Jump to navigation Jump to search
 
(42 intermediate revisions by 2 users not shown)
Line 1: Line 1:
 
=Verification using LUND and evio files=
 
=Verification using LUND and evio files=
The LUND files are broken into 1000 events per file to produce manageable GEMC output file sizes.  The kinematics of these moller events is shown fin Figure 1.  A Lorenz contraction occurs for a particle's momentum component that is parallel to the beam line.  As the angle of the particle approaches a direction perpendicular to the beam line, the Lorentz contraction  decreases.  As a result, a uniform angular distribution in the Lab frame will not be uniform in the CM frame. 
+
The LUND files are broken into 1000 events per file to produce manageable GEMC output file sizes.  The kinematics of these Moller events is shown fin Figure 1.   
  
[[File: Mankowski_Diagram.png |thumb | border | center |600 px |alt=Mankowski Diagram demonstrating Lorentz contraction|'''Figure 1:''' A Mankowski diagram demonstrating the Lorentz contraction increasing as the z component approaches the speed of light.  Taking the perpendicular axis as the lab frame, the spacing between the arbitary measurements is equal when viewed from within the specific frame, but unequal as shown by the dots.]]
 
  
This implies that the number of events that occur in the lab frame of reference near the beam line is larger than the number as it approaches a perpendicular direction. To understand the "density" of the number of events per bins in the lab frame, a study of 1000 events in the center of mass frame per 1 degree in the lab frame is investigated.  A weighting factor, used to reproduce the moller cross section, appears in the LUND file but not the GEMC evio output file thereby requiring both the LUND and evio files to be read simultaneously.
+
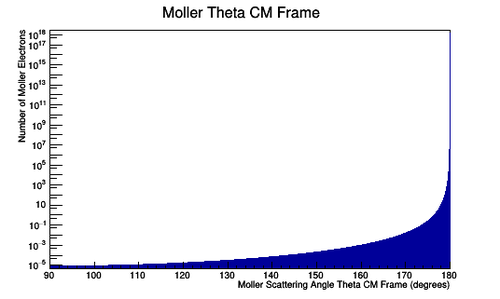
[[File:MolMomCM_11_2.png |thumb | border | center |500 px |alt=Moller Momentum Center of Mass Frame |'''Figure 1a:''' A plot of Moller electron momentum in the center of mass frame.]][[File:MolTheteaCM_full.png |thumb | border | center |500 px |alt=Moller Theta Center of Mass |'''Figure 1b:'''A plot of Moller electron scattering angle theta in the center of mass frame.]]
  
==1000 events per degree of 5 to 40 degrees in the Lab Frame==
+
=[[DV_RunGroupC_Moller#DC_hits_to_Moller_XSection|back]]=
Examining the CM Frame Theta angles which correspond to Lab frame angles within 5-40 degrees (with bin widths of 1 degree), for only on degree in Phi (0 degrees).  For each degree in Theta in the Lab frame, the correct kinematic variables for a specific events is written to a LUND file 1000 times. 


[[File:MolThetaLab_unweighted.png |thumb | border | center |500 px |alt=Lab Frame Moller Lab Frame |'''Figure 1:''' A plot of the number of Moller scattering angle theta in the lab frame.  The width of the bins is 0.5 degrees for the angles 5 to 40 in the lab frame.]][[File:MolThetaCM_unweighted_zoom.png |thumb | border | center |500 px |alt=Lab Frame Moller CM Frame |'''Figure 1:''' A plot of the number of Moller scattering angle theta in the center of mass frame.  The width of the bins is 0.5 degrees for the angles 5 to 40 in the lab frame.]]


These events are read from the evio file using


The Moller Scattering angle Theta is read from the LUND file, it's weight applied, and it's weight adjusted by dividing by the number it was multiplied by (1000) to give a differential cross-section for one electron.  This is plotted against the theoretical differential cross-section for one Moller electron.


<center>[[File:MolThetaCM_Theory.png]]</center>


From the evio file, a histogram can be constructed that will only record the Moller events which result in hits in the drift chamber.  A hit for this setting is the procID=90


Plotting the Moller scattering angle Theta in the Center of Mass frame just for on occurance of the CM angle gives the Moller Differential Cross-section.


<center>[[File:DC_HitsThetaCMweighted1.png]]</center>


Adjusting the weight by the number of times the specific angle caused hits.  We should recover the Moller differential cross-section as found previously.


<center>[[File:DC_HitsThetaCMweighted_adjusted.png]]</center>


Once the validity of the Moller differential cross-section is established, we can transform from the center of mass to the lab frame as shown earlier.  Since the detector is in the lab frame, the hits collected will have to be used to compose a histogram for the Moller scattering angle in the lab frame.  We can show that the Moller events that register as hits in the lab matches the Moller differential cross-section in the lab.


<center>[[File:DC_HitsThetaLabweighted_adjusted.png]]</center>


==Isotropic Spread in CM Frame for 5-40 degrees in Lab==
 
As was done for the situation of 1000 events per degree in the lab frame of reference, the isotropic distribution of scattering angle theta in the center of mass frame can be weighted to reproduce a Moller differential cross-section.


<center>[[File:LH2_0Sol_n100Tor_11GeV_Phi0deg_ShieldOut_MolThetaCMWeighted.png]]</center>


Similarly, as was done earlier, the center of mass frame is transfered to the lab frame.


<center>[[File:LH2_0Sol_n100Tor_11GeV_Phi0deg_ShieldOut_MolThetaLabWeighted.png]]</center>


Since the dimension parallel to the direction of motion "compresses" with speeds approaching the speed of light, the number of events that occur at 5 degrees are different than 40 degrees.  Collecting the number of events that occur within 0.5 degree bin width.


<center>[[File:BinCounts.png]]</center>


This can be plotted by dividing each entry into the bin by the number of events per that bin and multiplying by the corresponding weight factor.


<center>[[File:LH2_0Sol_n100Tor_11GeV_Phi0deg_ShieldOut_MolThetaLabWeightedAdjusted.png]]</center>


=Determining wire-theta correspondance=
 
To associate the hits with the Moller scattering angle theta, the occupancy plots of the drift chamber hits by means of wire numbers and layer must be translated using the physical constraints of the detector.  Using the data released for the DC:


DC: Drift Chambers[https://www.jlab.org/Hall-B/clas12-web/specs/dc.pdf  (specs)]


This gives the detector with a working range of 5 to 40 degrees in Theta for the lab frame, with a resolution of 1m radian.


This sets the lower limit:


<center><math>\frac{5^{\circ}}{1}\frac{\pi\ radians}{180^{\circ}}=.0872664626\ radians</math></center>


This sets the upper limit:


<center><math>\frac{40^{\circ}}{1}\frac{\pi\ radians}{180^{\circ}}=.698131700798\ radians</math></center>


Taking the difference,


<center><math>.698131700798-.0872664626\approx\  .61086523198\  radians</math></center>


Dividing by 112, we find


<center><math>\frac{.61086523198}{112}=.005454153912\ radians\approx\ 0.0055\ radians</math></center>


=CED Verification=
 
Using CED to verify the angle and wire correlation,
 
==Super Layer 1:Layer 1==


For a hit at layer 1, wire 1 we find the corresponding angle theta in the lab frame to be 4.91 degrees
 
<center>[[File:Layer1Wire1Hit.png]]</center>


For a hit at layer 1, wire 2 we find the corresponding angle theta in the lab frame to be 5.19 degrees
 
<center>[[File:Layer1Wire2.png]]</center>


Finding the difference between the two wires,


<center><math>5.19-4.91=.28^{\circ} \frac{\pi\ radians}{180^{\circ}}=0.004886921906\approx\ 0.00489\ radians</math></center>


Examing a hit at layer 1, wire 112 we find the corresponding angle theta in the lab frame to be 40.70 degrees
 
<center>[[File:Layer1Wire112.png]]</center>


This sets the lower limit:


<center><math>\frac{4.91^{\circ}}{1}\frac{\pi\ radians}{180^{\circ}}=.085695666273\ radians\approx 0.0857\ radians</math></center>


This sets the upper limit:


<center><math>\frac{40.70^{\circ}}{1}\frac{\pi\ radians}{180^{\circ}}=.710349005562\ radians\approx 0.710\ radians</math></center>


Taking the difference,


<center><math>.710349005562-.085695666273\approx\  .625\  radians</math></center>


Dividing by 112, we find


<center><math>\frac{.624653339289}{112}=.005577261958\ radians\approx\ 0.00558\ radians</math></center>


Noting the difference from the spacing for a single cell, to the entire detector layer


<center><math>0.00489-0.00558=0.00069\ \approx .001\ radians</math></center>


An uncertainty of this magnitude in radians corresponds to an angular uncertainty of


<center><math>.001\ radian\ \frac{180^{\circ}}{\pi\ radians}\approx .0573^{\circ}</math></center>


Testing this for a random angle, 78 degrees we find


<center><math>0.00558\times 78\ = 0.43524\ radians \frac{180^{\circ}}{\pi\ radians}\approx 24.94^{\circ}</math></center>


Adding this to the starting angle of 4.91 degrees


<center><math>4.91^{\circ}+24.94^{\circ}=29.85^{\circ}\pm .0573^{\circ}</math></center>


Comparing this to CED at wire 78


<center>[[File:Layer1Wire78.png]]</center>


<center><math>\Longrightarrow 29.85^{\circ}\pm .0573^{\circ}\approx 29.88^{\circ}</math></center>


==Super Layer 1:Layer 2==
 
For a hit at layer 2, wire 1 we find the corresponding angle theta in the lab frame to be 5.00 degrees
 
<center>[[File:Superlayer1_layer2_wire1.png]]</center>


Examing a hit at layer 2, wire 112 we find the corresponding angle theta in the lab frame to be 41.05 degrees
 
<center>[[File:Superlayer1_layer2_wire112.png]]</center>


This sets the lower limit:


<center><math>\frac{5.00^{\circ}}{1}\frac{\pi\ radians}{180^{\circ}}=.0872664626\ radians\approx 0.0873\ radians</math></center>


This sets the upper limit:


<center><math>\frac{40.70^{\circ}}{1}\frac{\pi\ radians}{180^{\circ}}=.716457657944\ radians\approx 0.716\ radians</math></center>


Taking the difference,


<center><math>.716457657944-..0872664626\approx\  .629\  radians</math></center>


Dividing by 112, we find


<center><math>\frac{.629191195344}{112}=.00561777853\ radians\approx\ 0.00562\ radians</math></center>


==Super Layer 1:Layer 6==
 
<center>[[File:Superlayer1_layer6_wire1.png]]</center>


<center>[[File:Superlayer1_layer6_wire112.png]]</center>


==Superlayer 2:Layer 1==


<center>[[File:Superlayer2_layer1_wire1.png]]</center>


<center>[[File:Superlayer2_layer1_wire112.png]]</center>
 

Latest revision as of 21:52, 27 July 2017

Verification using LUND and evio files

The LUND files are broken into 1000 events per file to produce manageable GEMC output file sizes. The kinematics of these Moller events is shown fin Figure 1.
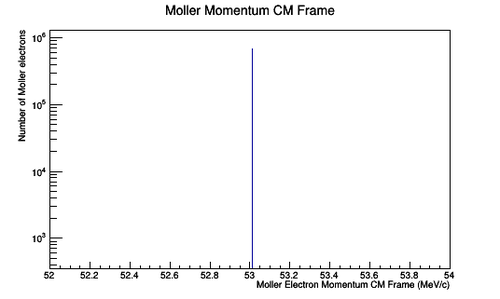
Moller Momentum Center of Mass Frame
Figure 1a: A plot of Moller electron momentum in the center of mass frame.
Moller Theta Center of Mass
Figure 1b:A plot of Moller electron scattering angle theta in the center of mass frame.

back