Difference between revisions of "CH HPGe Efficiency"
| Line 55: | Line 55: | ||
<gallery heights="300" widths="550" class="center"> | <gallery heights="300" widths="550" class="center"> | ||
| − | CH_ADC_Eu152_OnAxis_7-26-22.png|'''Figure | + | CH_ADC_Eu152_OnAxis_7-26-22.png|'''Figure 3:''' Eu152 Emission spectrum captured using HPGe detector and ADC in clean room on 7/26/22. Eu152 source placed 45cm from end cap of detector directly on central axis. The red arrows indicate peaks used in regression for energy calibration. |
| − | CH_Eu152_OnAxis_Log_7-26-22.png|'''Figure | + | CH_Eu152_OnAxis_Log_7-26-22.png|'''Figure 4:''' Energy calibrated and time normalized spectrum from Figure 4. |
</gallery> | </gallery> | ||
| Line 77: | Line 77: | ||
<gallery heights="300" widths="550" class="center"> | <gallery heights="300" widths="550" class="center"> | ||
| − | CH_ADC_Eu152_OffAxis_7-26-22.png|'''Figure | + | CH_ADC_Eu152_OffAxis_7-26-22.png|'''Figure 5:''' Eu152 Emission spectrum captured using HPGe detector and ADC in clean room on 7/26/22. Eu152 source placed 45cm from the side of the cap of detector, 90 degrees from central axis of detector crystal. |
| − | CH_Eu152_OffAxis_Log_7-26-22.png|'''Figure | + | CH_Eu152_OffAxis_Log_7-26-22.png|'''Figure 6:''' Energy calibrated and time normalized spectrum from Figure 6. |
</gallery> | </gallery> | ||
Revision as of 00:12, 28 July 2022
Efficiency Measurements Summer 2022
Electronics Chain
Click here to view the electronics chain used for these efficiency measurements.
Experimental Setup
Measurements
Energy Calibration
A linear regression was performed on the (ADC Channel Number, Peak Energy) data set. The data set is included in the table below.
| Index | ADC Channel Number | Eu152 Peak Energy (KeV) |
|---|---|---|
| 1 | 689 | 244.70 |
| 2 | 937 | 344.28 |
| 3 | 1105 | 411.12 |
| 4 | 1187 | 443.96 |
| 5 | 2025 | 778.90 |
| 6 | 2247 | 867.37 |
| 7 | 2490 | 964.08 |
| 8 | 2796 | 1085.9 |
| 9 | 2862 | 1112.1 |
| 10 | 3607 | 1408.0 |
The conversion from ADC Channel to KeV is as follows:
The KeV per bin can be found by taking the derivative of the energy conversion, leading to a constant 0.398 KeV per bin.
Background Spectrum
On Axis
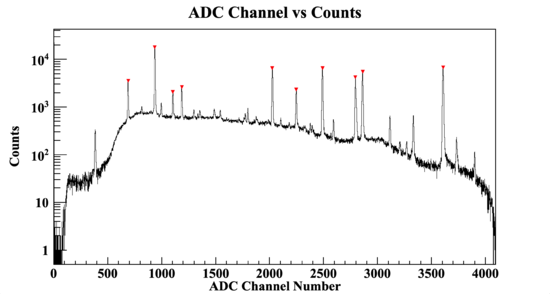
Figure 3: Eu152 Emission spectrum captured using HPGe detector and ADC in clean room on 7/26/22. Eu152 source placed 45cm from end cap of detector directly on central axis. The red arrows indicate peaks used in regression for energy calibration.
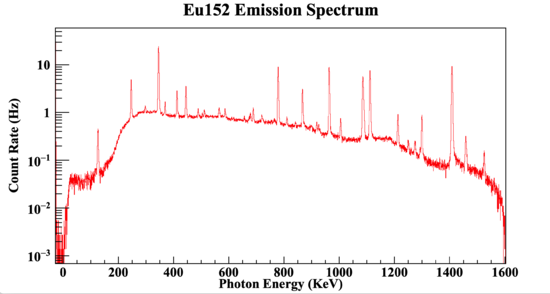
Figure 4: Energy calibrated and time normalized spectrum from Figure 4.


Run Parameters
| Date Performed | 7/26/22 |
| File Name | r7222.root |
| Run Time | 726 Seconds |
| Count Rate | 2442.06 Hz |
90 Degrees Off Axis
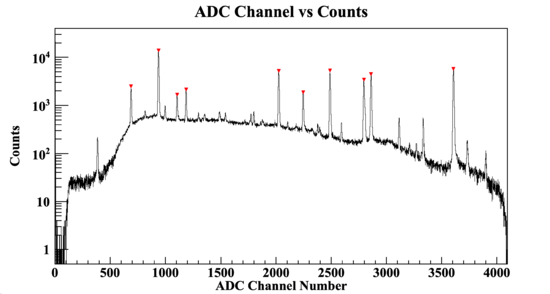
Figure 5: Eu152 Emission spectrum captured using HPGe detector and ADC in clean room on 7/26/22. Eu152 source placed 45cm from the side of the cap of detector, 90 degrees from central axis of detector crystal.
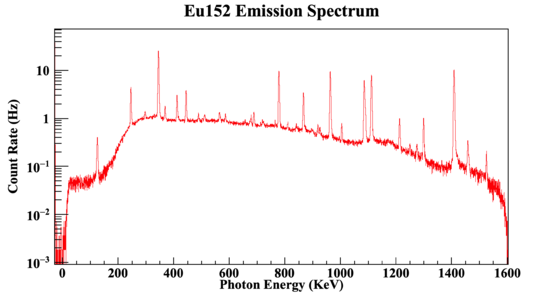
Figure 6: Energy calibrated and time normalized spectrum from Figure 6.


Run Parameters
| Date Performed | 7/26/22 |
| File Name | r7223.root |
| Run Time | 542 Seconds |
| Count Rate | 2634.47 Hz |
Past Work
Most likely incorrect
Eu152 Calibration
- HPGe calibrated using Eu152 source

As of 9/28/21
The calibration used to map from ADC channel number to KeV is:
Where x = channel 9 of the ADC and is input as PADC.PADC785N[9].
Total Efficiency
This is total efficiency using the Gadolinium foil as the source.
For the ease of calculation, I will use the outgoing photon rate from the Gd foil as tabulated by MCNP, thanks to Paul Stonaha. The number given was into 2pi, towards the HPGe detector, multiplying by 2 should give the rate into 4pi.
The 897 KeV peak found in the Gd in/out measurements can be attributed to two different lines created by neutron capture on Gd157. The high purity germanium detector used in this experiment would not be able to resolve the two distinct lines as the resolution is not fine enough. However, adding the intensities together should yield the theoretical rate for the peak measured at that energy.
The first peak is 897.506 KeV with a relative intensity of 17.846%, according the capgam nndc data repository.
The second peak is 897.62 KeV with a relative intensity of 16%, according the capgam nndc data repository.
(0.17846 + 0.16) (2*1374Hz) (234000) = Rate
234000 is the total thermal neutron capture cross section for 157Gd
Note: the fudge factor comes from the nucleus being excited and then de-exciting from the neutron absorption and emits on average, 4 photons per neutron capture
Then find detected rate using HPGe
Divide (detected rate) by (theoretical rate) for total detector efficiency
An easier way to calculate the detector efficiency is
Theoretical total rate = 2748 Hz from simulations
| Line Energy | Line Weighting | Detected Rate | Detector Efficiency |
|---|---|---|---|
| 897 KeV (2 lines) | 0.03967382135 | 0.357 Hz | 0.33% 0.03 |
| 1107 KeV | 0.02885336857 | 0.264 Hz | 0.33% 0.03 |
| ~1186 KeV (2 lines) | 0.05145546699 | 0.511 Hz | 0.36% 0.03 |