Difference between revisions of "Analysis"
(→P<3) |
|||
| Line 123: | Line 123: | ||
| − | [[Image: | + | [[Image:e_total_vs_e_inner1_before_cuts_file_dst25754.gif|200px]] |
| − | [[Image: | + | [[Image:e_total_vs_e_inner1_after_cuts_file_dst25754.gif|200px]]<br> |
=====0.5<P<1===== | =====0.5<P<1===== | ||
Revision as of 17:16, 13 August 2007
EG1 run database
run summary
polarization info
Particle Identification
Electron
Cuts
Calorimeter based cuts
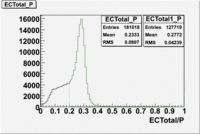
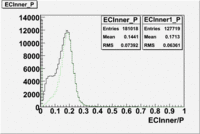
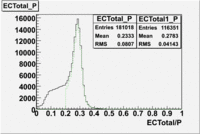
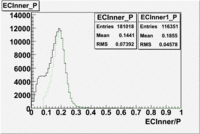
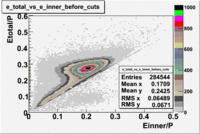
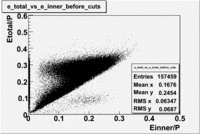
The distributions below represent two types of cuts applied to improve the electron particle identification (PID) using a 4 GeV electron beam incident on an NH3 target. The electron calorimeter is segmented into an inner and an outer region. The total energy absorbed by the calorimeter system is recorded in the variable . The momentum () is calculated using the reconstructed track and the known torus magnetic field. The distributions of and are shown below where both have been divided by the electron momentum and no cuts have been applied.
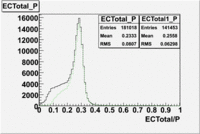
Without any cuts we have 181018 entries. After using the following cut we are getting 127719 entries, which is about 70.55% of 181018.
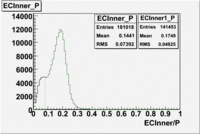
After the cut on the energy deposited into inner part of electron calorimeter, number of entries decreases by 22%.
Both cuts and
In case of using the cuts of the total deposited energy and the energy deposited into inner calorimeter number of entries decreases ~36%
summary table
The "# of triggers" columns represents the number of events which generated a signal above threshold in the calorimeter and the scintillator. The expected # of events column represents the number of reconstructed events with tracks that also make it through the cuts defined in the table.
The semi-inclusive analysis will focus on the 4 GeV and 6 GeV data which have both inbending and outbending torus settings. Specifically runs 28074 - 28579 ( 4 GeV) and Runs 27356 - 27499 and 26874 - 27198 (6 GeV)
| Beam Energy | Torus Current | Begin Run | End Run | file used | cuts | # trig() | expected # evts() | ||
|---|---|---|---|---|---|---|---|---|---|
| and | |||||||||
| 1606 | 1500 | 25488 | 25559 | dst25504_02.B00 | 64% | 49.5% | 78% | 60 | 3.2 |
| 1606 | 1946 | 25560 | 25605 | 44 | |||||
| 1606 | 1500 | 25669 | 25732 | dst25669_02.B00 | 64% | 49% | 78% | 226 | 10 |
| 1606 | 1500 | 25742 | 26221 | dst25754_02.B00 | 21% | 11% | 24% | 3154 | 13.3 |
| 1606 | -1500 | 26222 | 26359 | dst26224_02.B00 | 4.6% | 3% | 6.6% | 703 | 13.1 |
| 1724 | -1500 | 27644 | 27798 | dst27649_02.B00 | 4.8% | 2.2% | 5.9% | 211 | 20 |
| 1724 | 1500 | 28512 | 28526 | 159 | |||||
| 1724 | -1500 | 28527 | 28532 | 93 | |||||
| 2288 | 1500 | 27205 | 27351 | dst27225_02.B00 | 20.2% | 13% | 25.6% | 1647 | 16.1 |
| 2562 | -1500 | 27799 | 27924 | dst27809_02.B00 | 5.7% | 4.6% | 8.6% | 1441 | 13.1 |
| 2562 | -1500 | 27942 | 27995 | dst27942_02.B00 | 6.1% | 4.4% | 8.9% | 841 | 32.3 |
| 2562 | 1500 | 28001 | 28069 | dst28002_02.B00 | 27.8% | 13% | 29.6% | 1013 | 30.7 |
| 2792 | -1500 | 27936 | 27941 | dst27937_02.B00 | 6.7% | 5% | 9.9% | 69 | 20.6 |
| 3210 | -2250 | 28549 | 28570 | 436 | |||||
| 4239 | 2250 | 28074 | 28277 | dst28075_02.B00 | 35.3% | 23.9% | 40.5% | 2278 | 19.6 |
| 4239 | -2250 | 28280 | 28479 | dst28281_02.B00 | 9.1% | 9.4% | 13.6% | 2620 | 15.2 |
| 4239 | 2250 | 28482 | 28494 | 7 | |||||
| 4239 | -2250 | 28500 | 28505 | 107 | |||||
| 4239 | 2250 | 28506 | 28510 | dst28509_02.B00 | 29.5% | 22% | 36% | 75 | 18.1 |
| 5627 | 2250 | 27356 | 27364 | dst27358_02.B00 | 33.2% | 27.8% | 41.3% | 56 | 19.4 |
| 5627 | -2250 | 27366 | 27380 | dst27368_02.B00 | 12.6% | 14.8% | 19.5% | 130 | 13.6 |
| 5627 | 2250 | 27386 | 27499 | dst27388_02.B00 | 33.4% | 27.8% | 41.4% | 1210 | 20.2 |
| 5627 | 965 | 27502 | 27617 | 493 | |||||
| 5735 | -2250 | 26874 | 27068 | dst26904_02.B00 | 13% | 15% | 20% | 1709 | 19.9 |
| 5735 | 2250 | 27069 | 27198 | dst27070_02.B00 | 33.3% | 28.8% | 42.2% | 1509 | 15 |
| 5764 | -2250 | 26468 | 26722 | dst26489_02.B00 | 12.2% | 14.4% | 19.1% | 1189 | 10 |
| 5764 | 0 | 26723 | 26775 | 268 | |||||
| 5764 | -2250 | 26776 | 26851 | dst26779_02.B00 | 13.5% | 15.5% | 20.5% | 662 | 15.9 |
Cut on the number of photoelectrons
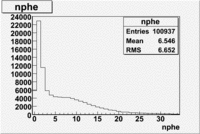
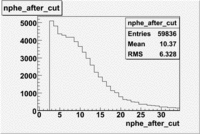
In this case is used a cut on the number of photoelectrons, which is . The plots below show the
effect of the number of photoelectrons cuts on the Cerenkov distribution. We see that after using cut the number of entries decreases ~40.7%
Tamuna: It looks like you didn't center the bins around integer values. new TH1F("name","name", 35,-0.5,34.5)
Plot of vs
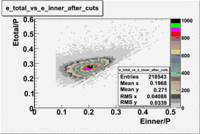
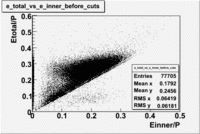
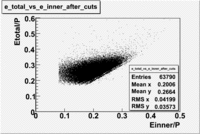
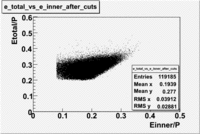
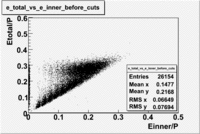
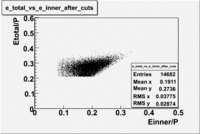
In this case is used file dst25754(Energy 1.6 GeV and Torus 1500) and are applied the following EC cuts: For ECtotal - , for EC inner - .
P<3
After using above cuts the number of entries decreases ~23.2%
Tamuna:  Make all 2-D plots contour plots ("cont0") with the "colz" option so we get a scale.  The dots don't mean much after you get a lot of them
  Are you using "0.6" for the font size?
0.5<P<1
The number of entries decreased by ~17.7%
1<P<1.5
The number of entries decreased approximately by 24.3%
1.5<P<2
In this case the number of entries decreased by 43.9%
