Difference between revisions of "2n corr theta VS n-n energies"
Jump to navigation
Jump to search
| Line 22: | Line 22: | ||
Each distribution in this plot uses the same respective set of neutrons as above, except instead of taking the average of two neutrons in coincidence, the energy of each individual neutron is plotted. | Each distribution in this plot uses the same respective set of neutrons as above, except instead of taking the average of two neutrons in coincidence, the energy of each individual neutron is plotted. | ||
| + | |||
[[File:2NCorr singles erg corrVSUncorr.png|700px]] | [[File:2NCorr singles erg corrVSUncorr.png|700px]] | ||
Latest revision as of 22:08, 24 August 2018
2 energy bins, 6 theta bins
2n_corr_theta_VS_n-n_energies_(2)
3 energy bins, 5 theta bins
2n_corr_theta_VS_n-n_energies_(1)
4 energy bins, 4 theta bins
2n_corr_theta_VS_n-n_energies_(3)
5 energy bins, 3 theta bins
2n_corr_theta_VS_n-n_energies_(4)
Corr vs uncorr neutron energy
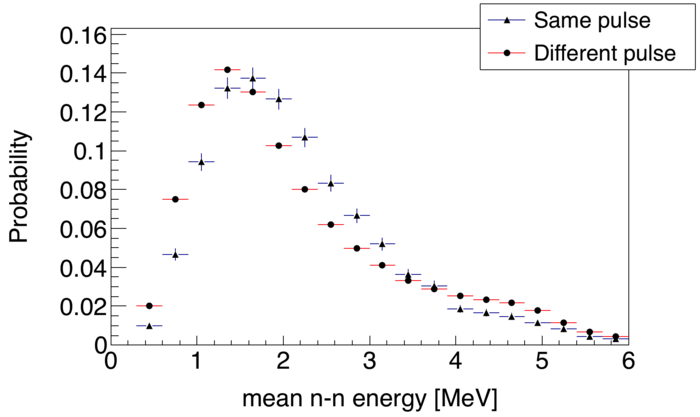
Below is a plot of mean neutron energy of neutron coincidences from the same pulse and neutron 'coincidences' from different pulses.

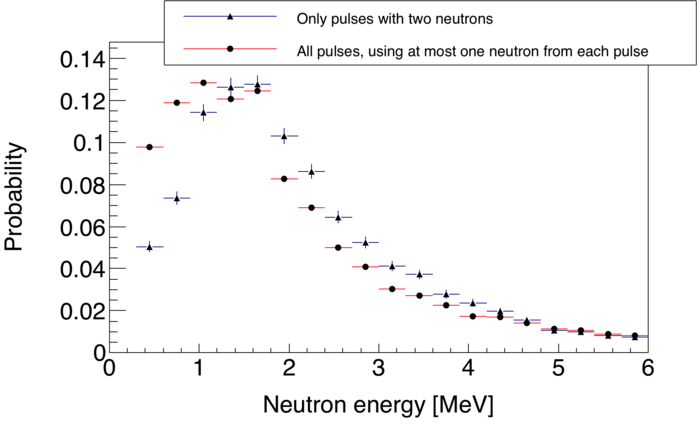
Each distribution in this plot uses the same respective set of neutrons as above, except instead of taking the average of two neutrons in coincidence, the energy of each individual neutron is plotted.
