Difference between revisions of "170048 10% Se Soil Mixture Analysis"
Jump to navigation
Jump to search
| Line 42: | Line 42: | ||
||Expanded Window Histogram || [[File:170048 PureSe ExpWindow 615 t 1115Sec.png|100px]] || [[File:170048 PureSe ExpWindow 1850 t 2350Sec.png|100px]] || [[File:170048 PureSe ExpWindow 3015 t 3515Sec.png|100px]] | ||Expanded Window Histogram || [[File:170048 PureSe ExpWindow 615 t 1115Sec.png|100px]] || [[File:170048 PureSe ExpWindow 1850 t 2350Sec.png|100px]] || [[File:170048 PureSe ExpWindow 3015 t 3515Sec.png|100px]] | ||
|- | |- | ||
| − | ||Signal in Thin Window || | + | ||Signal in Thin Window || <math> 2.072 \times 10^5 </math> || <math> 1.614 \times 10^5</math> || <math>1.152 \times 10^5 </math> |
|- | |- | ||
| − | ||Signal in Expanded Window || | + | ||Signal in Expanded Window || <math> 2.284 \times 10^5</math> || <math>1.804 \times 10^5 </math> || <math>1.329 \times 10^5 </math> |
|- | |- | ||
| − | ||<math> S_{Expanded} - S_{Thin} </math>|| | + | ||<math> S_{Expanded} - S_{Thin} </math>|| 21200 || 19000 || 17700 |
|- | |- | ||
| − | ||Integrated Background || | + | ||Integrated Background || <math>21200 \pm 65.2 </math> || <math> 9172 \pm 62.4 </math> || <math> 7764 \pm 58.6 </math> |
|- | |- | ||
| − | ||Signal - Background || | + | ||Signal - Background || <math> 197130 \pm 21200.10 </math> || <math> 152228 \pm 19000.10</math> || <math> 107436 \pm 17700.10 </math> |
|- | |- | ||
| − | ||Runtime (s) || | + | ||Runtime (s) || 500 || 500 || 500 |
|- | |- | ||
| − | ||Rate (Hz) || | + | ||Rate (Hz) || <math> 394.26 \pm 42.40 </math> || <math> 304.46 \pm 38.00 </math> || <math> 214.87 \pm 35.40 </math> |
|- | |- | ||
| − | ||Integral Decay Correction (Hz) || | + | ||Integral Decay Correction (Hz) || <math> 414.47 \pm 44.57 </math> || <math> 320.07 \pm 39.95 </math> || <math> 225.89 \pm 37.21 </math> |
|- | |- | ||
| − | ||Dead Time (%) || | + | ||Dead Time (%) || <math> 0.84 \pm 0.16 </math> || <math> 0.65 \pm 0.15 </math> || <math> 0.53 \pm 0.14 </math> |
|- | |- | ||
| − | ||Dead Time Corrected Signal (Hz) || | + | ||Dead Time Corrected Signal (Hz) || <math> 417.98 \pm 44.95 </math> || <math> 322.16 \pm 40.21 </math> || <math> 227.09 \pm 37.41 </math> |
|- | |- | ||
| − | ||.Dat File Entry For HL Plot || | + | ||.Dat File Entry For HL Plot || <math> 6.03 \pm 0.11 </math> || <math> 5.77 \pm 0.12 </math> || <math> 5.43 \pm 0.16 </math> |
|} | |} | ||
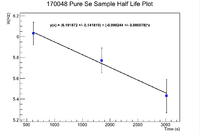
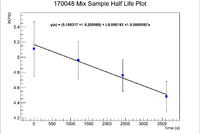
[[File:170048 PureSe HLPlot.png|200px]] [[File:170048 SeSoilMix HLPlot.png|200px]] | [[File:170048 PureSe HLPlot.png|200px]] [[File:170048 SeSoilMix HLPlot.png|200px]] | ||
Revision as of 22:52, 15 February 2018
Sample 170048 was a 10% mixture of selenium and soil. The mass of the inner selenium is 0.5145g, while the mass of the outer selenium is 0.1245g. The method used was the thin window analysis method as explained here LB Thesis Thin Window Analysis. Below is a table of values to continue with the analysis of the selenium soil mixture:
Below is a table for the pure selenium sample outside of the aluminum cylinder:


