Difference between revisions of "05/19/2011 n's detector threshold calibration source/(w/source)"
| (5 intermediate revisions by the same user not shown) | |||
| Line 1: | Line 1: | ||
| − | [https://wiki.iac.isu.edu/index.php/ | + | [https://wiki.iac.isu.edu/index.php/Roman_measurements go back] |
Below are my counts rate measurements as function of threshold voltage for n's detector. The source was CF252. The distance between source and n's PMT was about 50 cm. It was 1 PMT set up detector and experiment was hold in LDS on May 19 2011. | Below are my counts rate measurements as function of threshold voltage for n's detector. The source was CF252. The distance between source and n's PMT was about 50 cm. It was 1 PMT set up detector and experiment was hold in LDS on May 19 2011. | ||
| − | First the counts rate was calculated as: | + | ==First the counts rate was calculated as:== |
<math>\mbox{Rate} = \frac{N_{\mbox{source}} - N_{\mbox{w/source}}}{\mbox{Time}}</math> | <math>\mbox{Rate} = \frac{N_{\mbox{source}} - N_{\mbox{w/source}}}{\mbox{Time}}</math> | ||
| Line 28: | Line 28: | ||
| − | Let's recalculate all data using the formula: | + | ==Let's recalculate all data using the formula:== |
<math>\mbox{Ratio} = \frac{R_s - R_{w/s}}{R_{w/s}}</math> | <math>\mbox{Ratio} = \frac{R_s - R_{w/s}}{R_{w/s}}</math> | ||
| Line 57: | Line 57: | ||
| − | Let's compare with what Jason did (at different place,different time and different PMT): | + | ==Let's compare with what Jason did (at different place,different time and different PMT):== |
Below are Jason's data and calculations: | Below are Jason's data and calculations: | ||
| − | [[File:Table Jason.png | | + | [[File:Table Jason.png | 1200px]] |
And below I overlay my and Jason's results (linear scale): | And below I overlay my and Jason's results (linear scale): | ||
Latest revision as of 19:01, 24 May 2012
Below are my counts rate measurements as function of threshold voltage for n's detector. The source was CF252. The distance between source and n's PMT was about 50 cm. It was 1 PMT set up detector and experiment was hold in LDS on May 19 2011.
First the counts rate was calculated as:
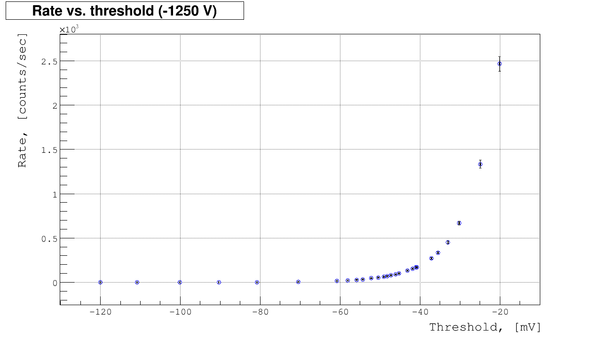
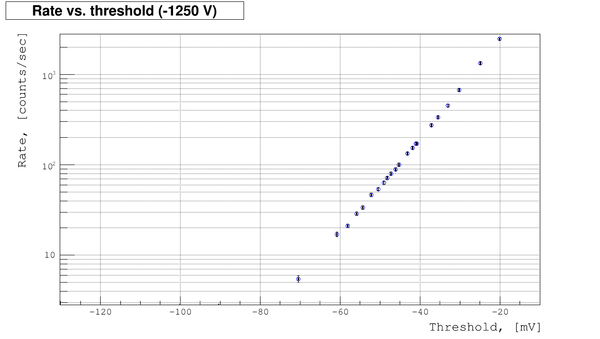
First I did my calibration for power supply voltage -1250 V:
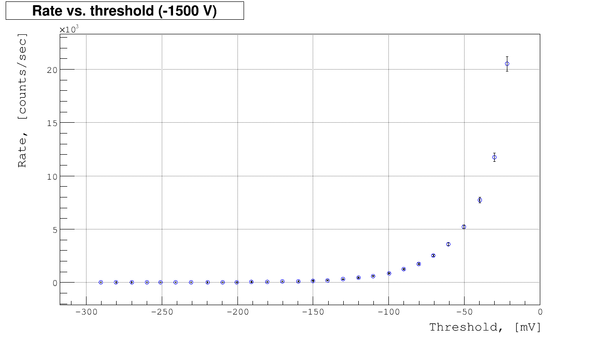
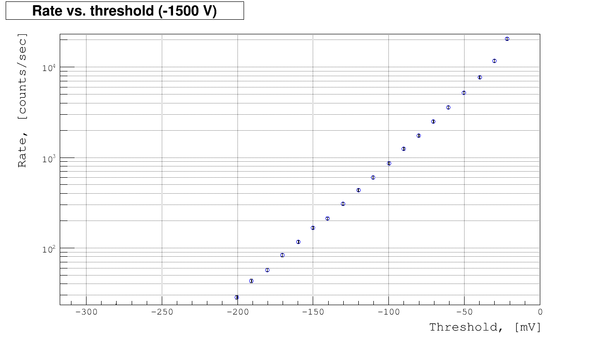
Second I did my calibration for power supply voltage -1500 V:
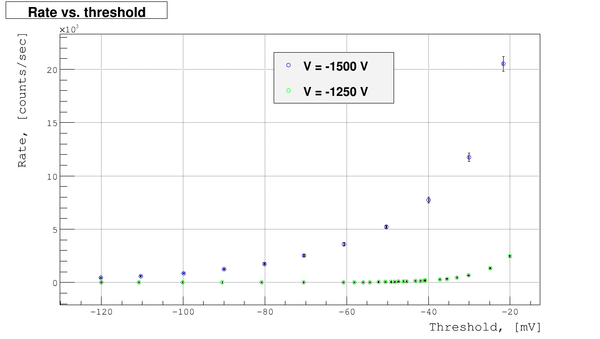
And bellow I overlay both cases (-1250 V and -1500 V)
There are no any plateaus, so what is the threshold should be?. Or maybe we are need to look at something different.
Let's recalculate all data using the formula:
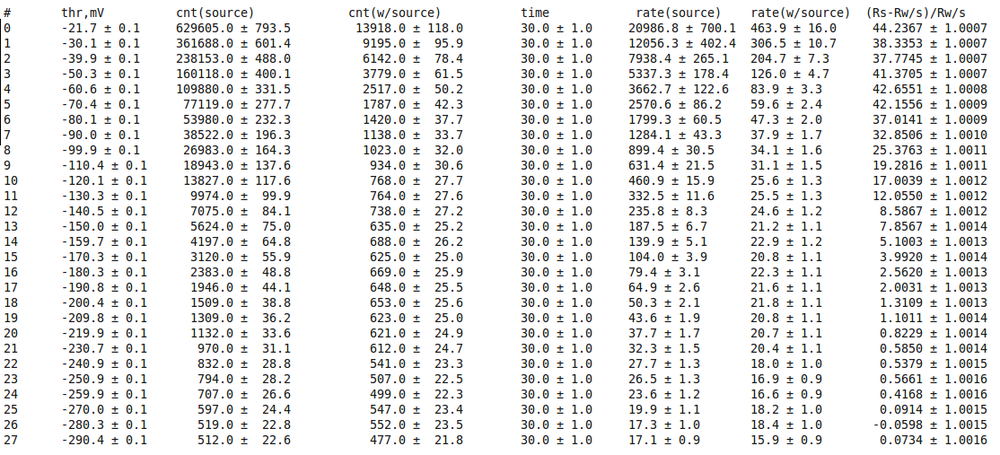
Below my data and calculations for the case of -1500 V power supply voltage:
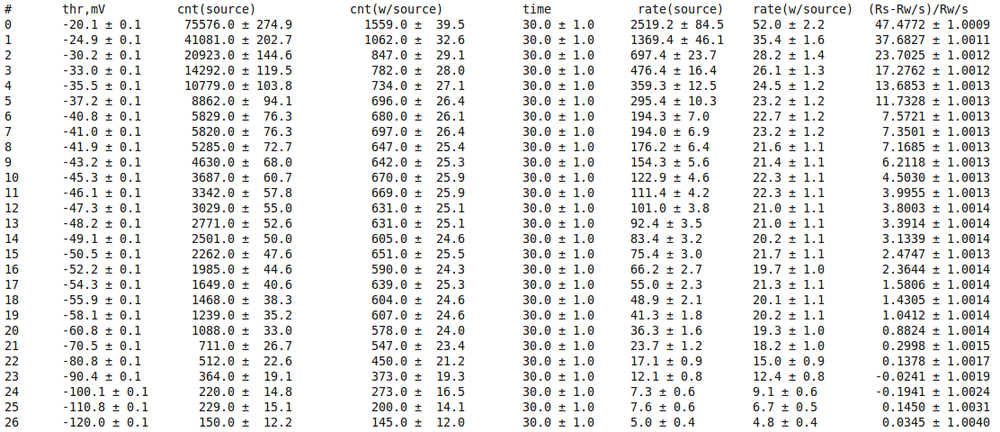
Below my data and calculations for the case of -1250 V power supply voltage:
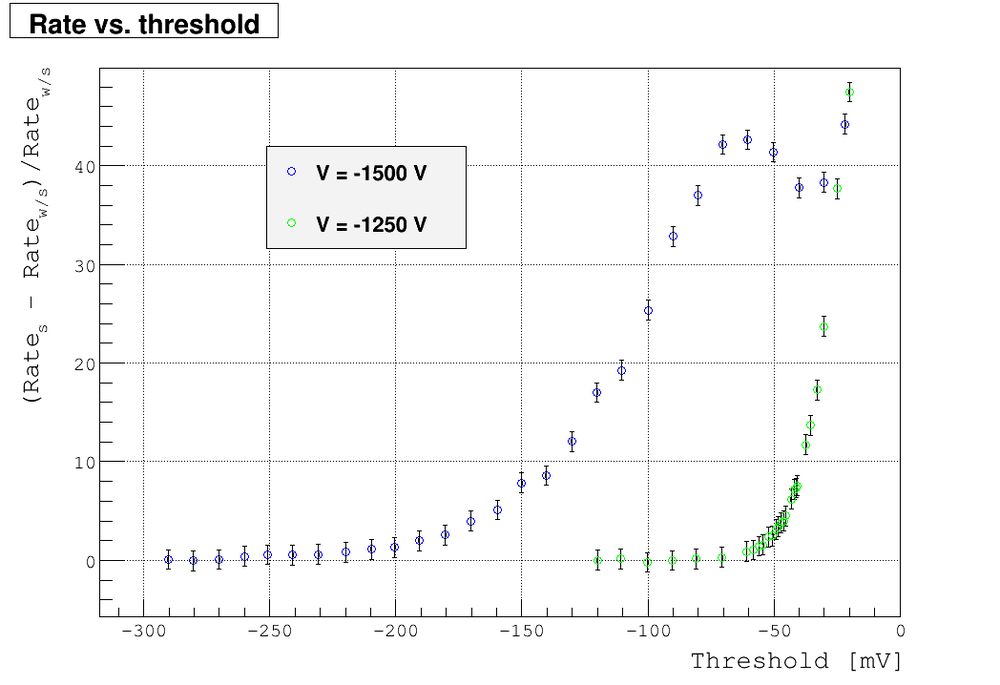
And below I overlay my results (linear scale):
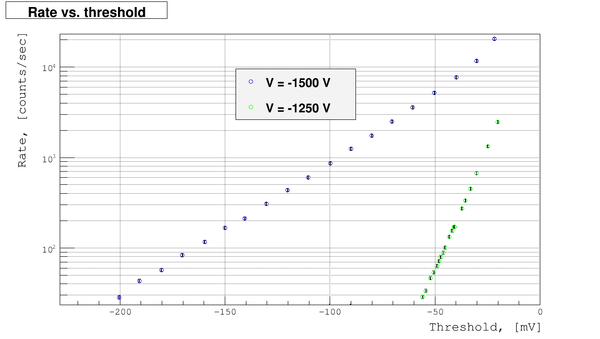
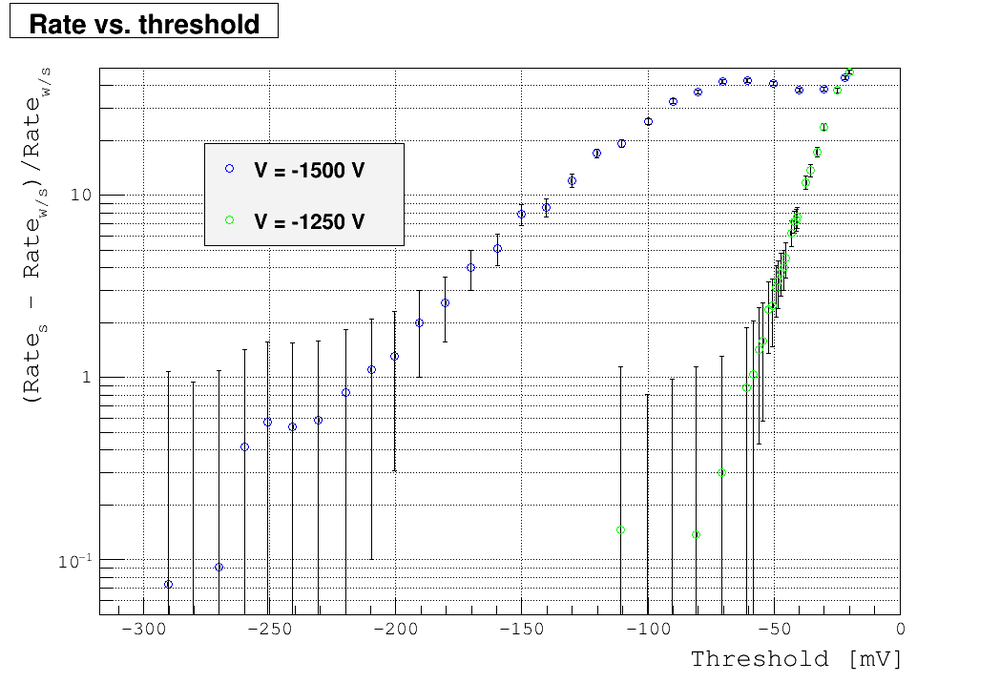
and in log scale:
There are two important conclusions at least for this type of PMT was used:
- The desirable threshold is about -50 mV
- The power supply voltage is as expected -1500 V (there are no plateau for -1250 V)
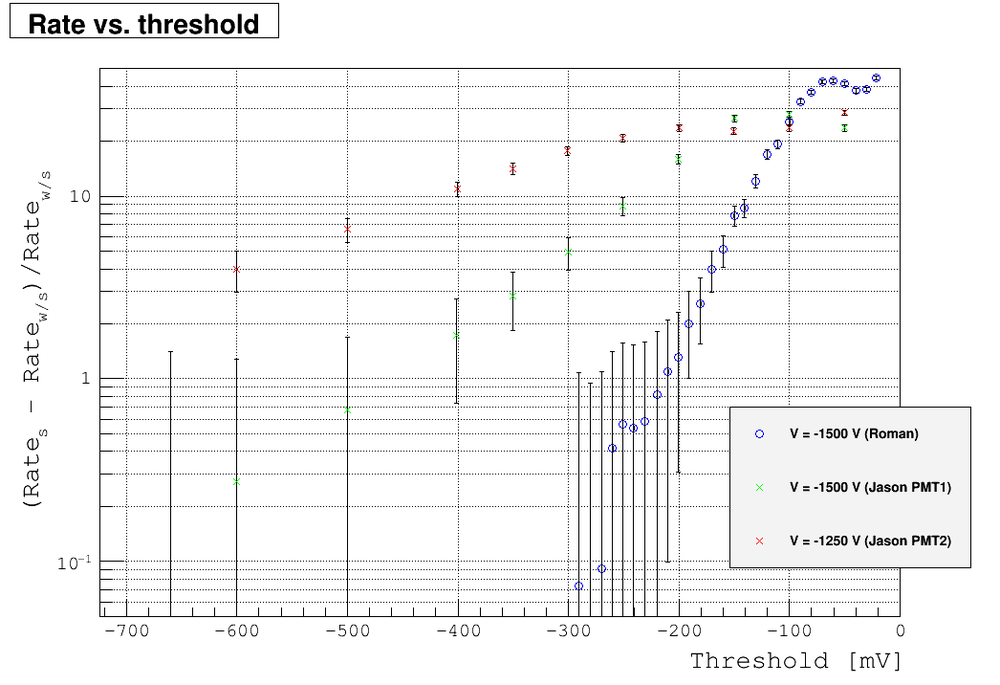
Let's compare with what Jason did (at different place,different time and different PMT):
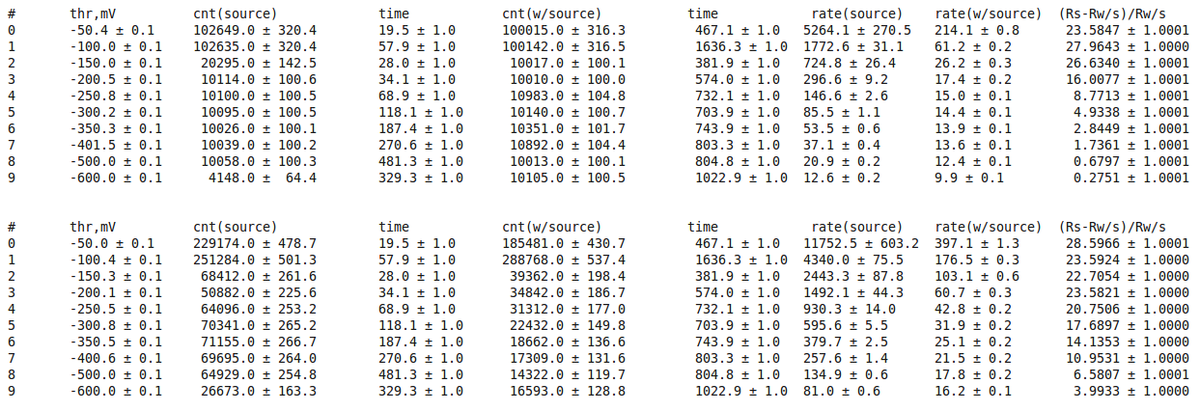
Below are Jason's data and calculations:
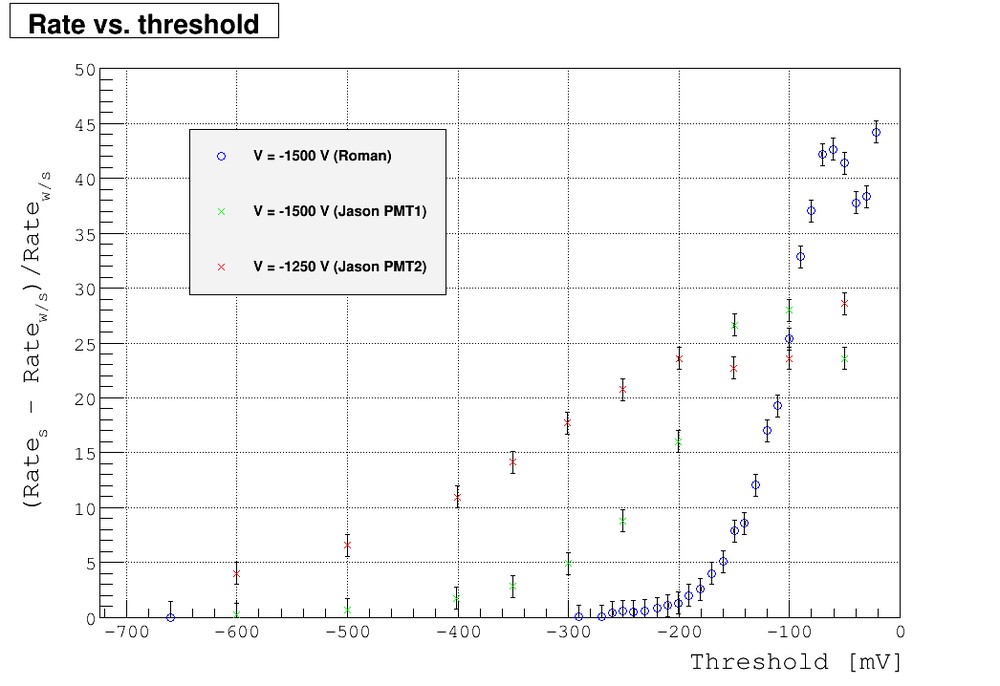
And below I overlay my and Jason's results (linear scale):
and in log scale:
Looks different.
- PMT?
- location?
