Difference between revisions of "05/13/2011 timing test"
| (45 intermediate revisions by the same user not shown) | |||
| Line 1: | Line 1: | ||
| + | [https://wiki.iac.isu.edu/index.php/Roman_measurements go back] | ||
| + | |||
| + | |||
Set up like that: | Set up like that: | ||
| Line 4: | Line 7: | ||
| − | The voltages and | + | The voltages, thresholds and widths are: |
{| border="1" cellspacing="0" style="text-align: center; width: 800px; height: 100px;" | {| border="1" cellspacing="0" style="text-align: center; width: 800px; height: 100px;" | ||
! scope="col" width="50" | | ! scope="col" width="50" | | ||
| Line 12: | Line 15: | ||
|- | |- | ||
!PS1 | !PS1 | ||
| − | | - | + | | -1000|| -100|| 50 |
|- | |- | ||
!PS1 | !PS1 | ||
| − | | - | + | | -1000|| -100|| 50 |
|- | |- | ||
!n's | !n's | ||
| Line 25: | Line 28: | ||
'''Let's do the timing test'''. The distances are between PS1+PS2 and n's PMT. The time is time difference between PS1(PS2) and n's detector signals | '''Let's do the timing test'''. The distances are between PS1+PS2 and n's PMT. The time is time difference between PS1(PS2) and n's detector signals | ||
| − | + | ||
| − | + | [[File:Tbl timing total.png | 1000px]] | |
| − | + | ||
| − | + | ||
| − | + | As the distance becomes 10 cm and less the coincidence rate becomes very low. I have: | |
| − | + | :▫ 10 cm: PS1+PS2+n 11 coinc/98 min, <math>(0.11\pm0.03)</math> coinc/min | |
| − | + | :▫ 5 cm: PS1+PS2+n 103 coinc/890 min, <math>(0.11\pm0.01)</math> coins/min | |
| − | + | :▫ 5 cm: PS1 118182 coinc/890 min, <math>(2.213\pm0.006)</math> coins/min | |
| − | + | :▫ 5 cm: PS2 138573 coinc/890 min, <math>(2.595\pm0.007)</math> coins/min | |
| − | + | ||
| − | + | ||
| − | + | ||
| − | + | Below is the plot of measured time as function of distances: | |
| − | + | :▫ plot for first 10 events (measurements on May 13, 2001) | |
| − | + | :▫ plot for last 20 events (measurements on May 16, 2001) | |
| − | + | :▫ combined plot for total 30 events | |
| − | + | ||
| − | + | ||
| − | + | [[File:Timing 1 10.png | 500px]] [[File:Timing 11 30.png | 500px]] | |
| − | + | ||
| − | + | [[File:Timing total 30.png | 1000 px]] | |
| − | + | ||
| − | + | ||
| − | + | As we expect the timing is increase as distance does. But there are some saturation region which probably related to back scattering. Here as we approach the back side of detector the fraction of light scattered from back side increases, so the effective distance increases as well and the time drops down. | |
| − | + | ||
| − | + | Let's approximate the experimental points by line excluding the saturation region: | |
| − | + | ||
| − | + | [[File:Timing line.png | 1000 px]] | |
| − | + | ||
| − | + | ||
| − | + | The average speed would be: | |
| − | + | ||
| − | + | <math>v = \frac{1}{p_0} = \frac{1}{0.1425} \approx 7\ \frac{cm}{ns}</math> | |
| − | + | ||
| − | + | so about 4 times less then speed of ligh. | |
| + | |||
| + | |||
| + | Here would be nice to have more statistics to improve the error but the problems here is that coincidence rate is about 3 per minute so to increase the statistics of this test we need a lot of time. | ||
Latest revision as of 19:01, 24 May 2012
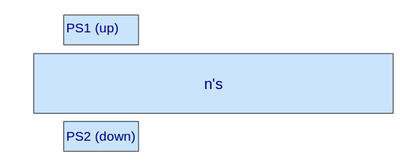
Set up like that:
The voltages, thresholds and widths are:
| PMT voltage, V | threshold, mV | discr. width, ns | |
|---|---|---|---|
| PS1 | -1000 | -100 | 50 |
| PS1 | -1000 | -100 | 50 |
| n's | -1500 | -200 | 10 |
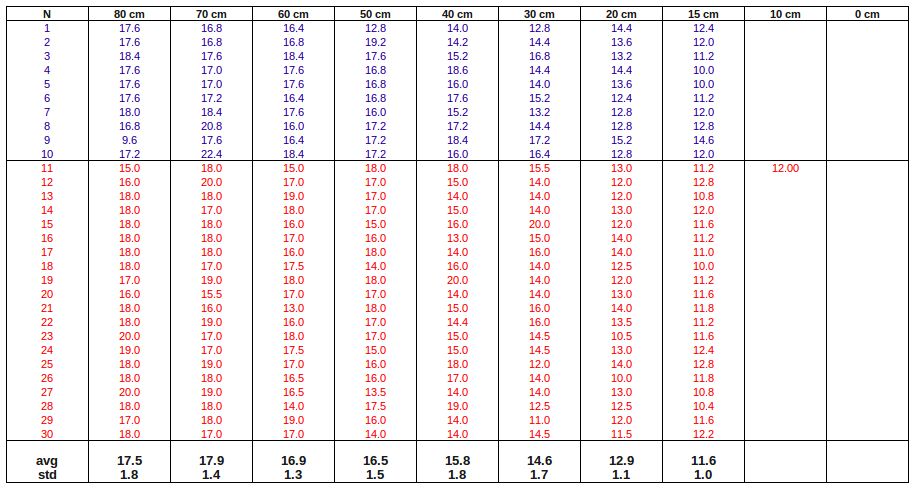
Let's do the timing test. The distances are between PS1+PS2 and n's PMT. The time is time difference between PS1(PS2) and n's detector signals
As the distance becomes 10 cm and less the coincidence rate becomes very low. I have:
- ▫ 10 cm: PS1+PS2+n 11 coinc/98 min, coinc/min
- ▫ 5 cm: PS1+PS2+n 103 coinc/890 min, coins/min
- ▫ 5 cm: PS1 118182 coinc/890 min, coins/min
- ▫ 5 cm: PS2 138573 coinc/890 min, coins/min
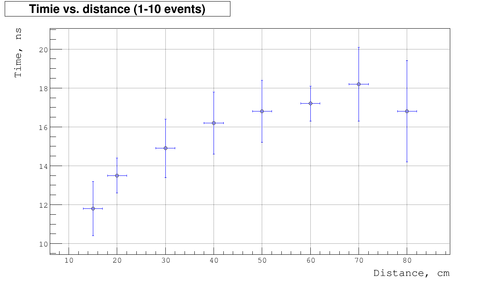
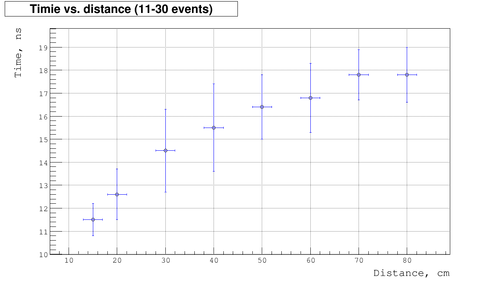
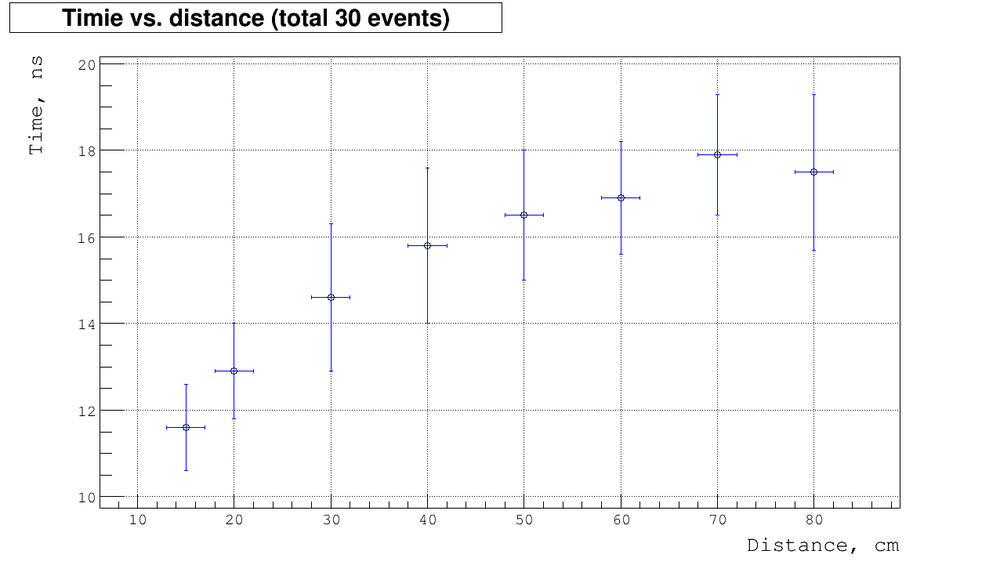
Below is the plot of measured time as function of distances:
- ▫ plot for first 10 events (measurements on May 13, 2001)
- ▫ plot for last 20 events (measurements on May 16, 2001)
- ▫ combined plot for total 30 events
As we expect the timing is increase as distance does. But there are some saturation region which probably related to back scattering. Here as we approach the back side of detector the fraction of light scattered from back side increases, so the effective distance increases as well and the time drops down.
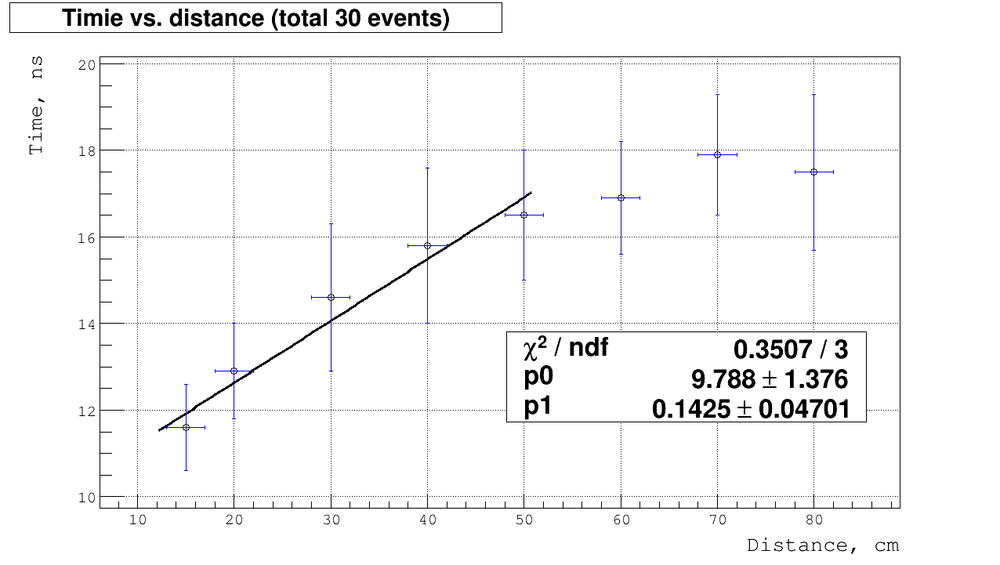
Let's approximate the experimental points by line excluding the saturation region:
The average speed would be:
so about 4 times less then speed of ligh.
Here would be nice to have more statistics to improve the error but the problems here is that coincidence rate is about 3 per minute so to increase the statistics of this test we need a lot of time.
