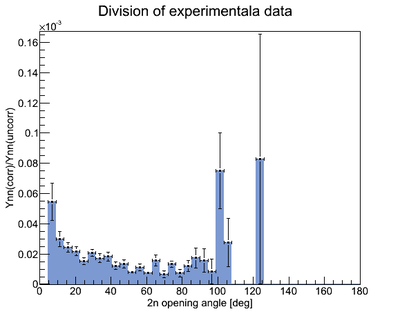
Relative efficiency
Some papers
File:Nn correlation extraction.pdf
Rletive efficiency obtained from the 2n opening angle w/ uncorrelated neutrons
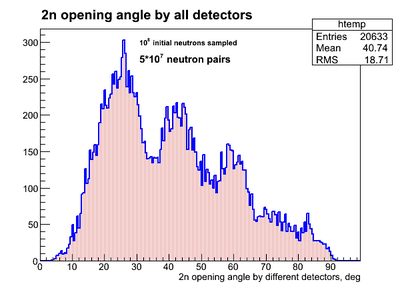
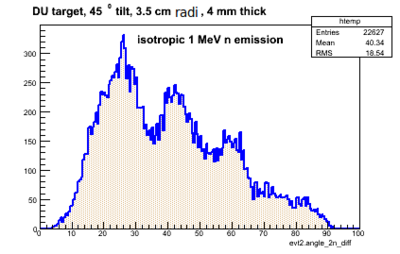
The result of simulation of 2n openeing angle obtained by different neutron detectors (each neutron hit different detector) having y-resolution is presented below. The source of neutrons was isotropic.
| Empty target, events sampled | DU target, events sampled |
|---|---|
|
|
| Point isotropic n-source w/o material | Volume isotropic n-source + DU material |
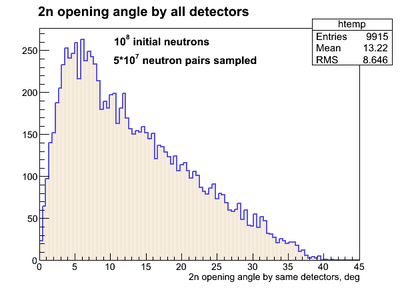
The result of simulation of 2n openeing angle obtained by the same neutron detectors (2 neutrons hit same detector) having y-resolution is presented below:
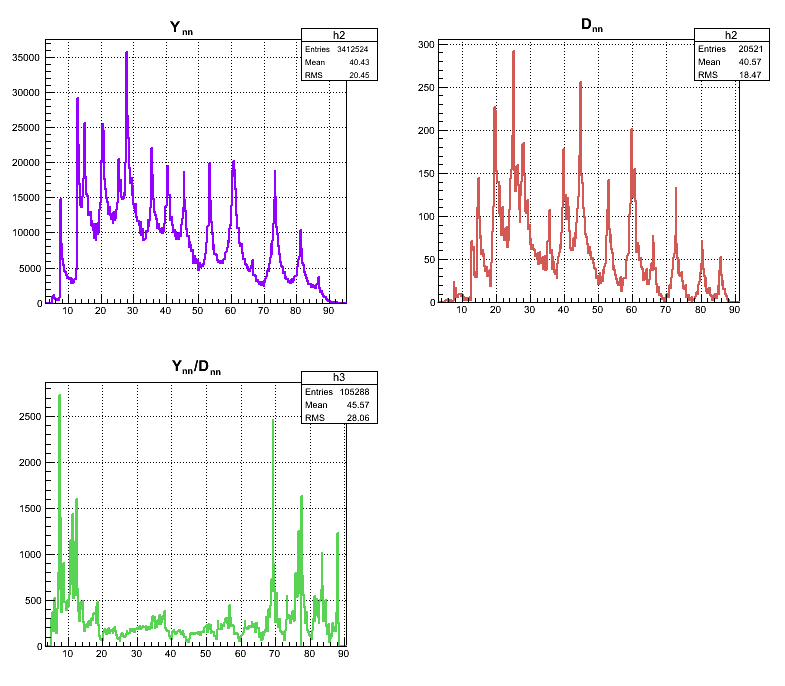
In the experiment our expereimental setup did not have y-resolution across the surface of the neutron detectors. So it was necessary to simulate the 2n opening angle for the neutron detectors w/o y-resolution. The result of the simulation of 2n opening angle (the 2n angles detected by all detectors are superimposed) for the case where thre was no y-resolution is going to be noted as . The experimental data obtained from run 4172 (DU target) on 2n opening angle for uncorrelated neutrons (i.e. in the case of isotropic source of neutrons) from different pulses is going to be noted as . The relative efficiency is defined as and it is plotted below as a result of bib-by-bin division of over .
Relative efficiency of the detecting system obtained using experimental data only (all runs)
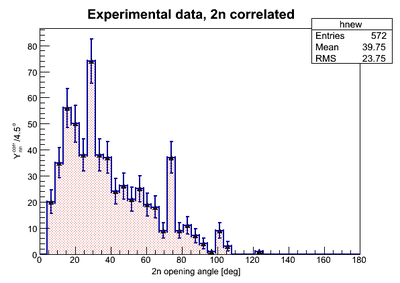
In this part the experimantal data are presented for the cases when (1) the 2n opening angle was measured for neutrons correlated and (2) the 2n opening angle was measured for neutrons uncorrelated (neutrons from separate pulses). In the figure below the experimental data on the 2n opening angle measured for the case of correlated neutrons is presented where the statistican error bar width is equal to along y-axis and 4.5 deg along x-axis (the bin width):
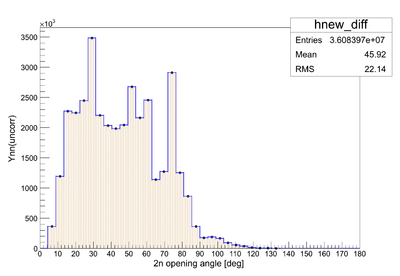
The experimental data on the 2n opening angle measured for the case of uncorrelated neutrons is presented in the next figure:
The result of the division of the two histograms () obtained for the described two cases is shown below:
