2-Neutron Correlation
Pre-setup Calculations
Big Detector Solid Angle Calculations
- MCNPX Simulation
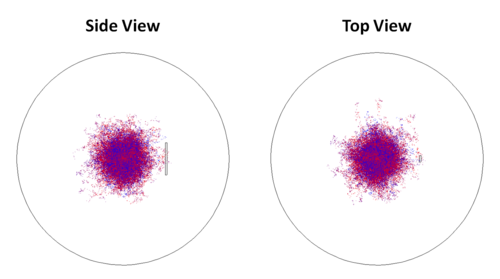
- 14 MeV neutron source, emitted isotropically ()
- Detector placed 1m away from source
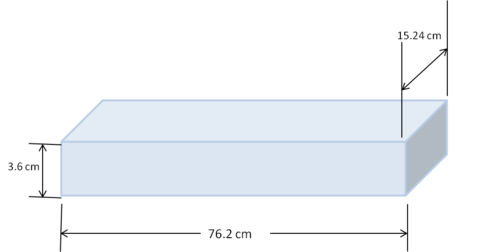
- face of the detector is 15.24cm x 76.2cm, and 3.6cm deep
The solid angle can be found from the number of particles hitting the detector as:
- Results
- Out of 1E9 neutrons generated, 8618287 neutrons hit the detector
-
- if the detector is placed 70cm away from the source,
- if the detector is placed 65cm away from the source,
-
- As a test to verify our results
- We change the detector size to 2cm by 2cm and used 1E9 neutrons again
- 32061 neutrons struck the detector
- And, as a second test to verify our results
- We change the detector size to 1cm by 1cm and used 1E9 neutrons again
- 7965 neutrons struck the detector
- Now, what neutron singles rate into the detector should correspond to 1 fission per pulse?
- If we have 1 fission per pulse and each fission emits on average 2.3 neutrons, we should expect 2.3 neutrons/pulse
- The number of neutrons hitting the detector per pulse is found as
- @ 1 meter => 0.0198 neutrons hitting the detector per pulse
- @ 70 cm => 0.0379 neutrons hitting the detector per pulse
- Taking into account the efficiency of the detector , the number detected per pulse can be found as
- @ 1 meter from source => () neutrons detected per pulse
- @ 70 cm from source => () neutrons detected per pulse
Neutron and Photon Flux Through Lead
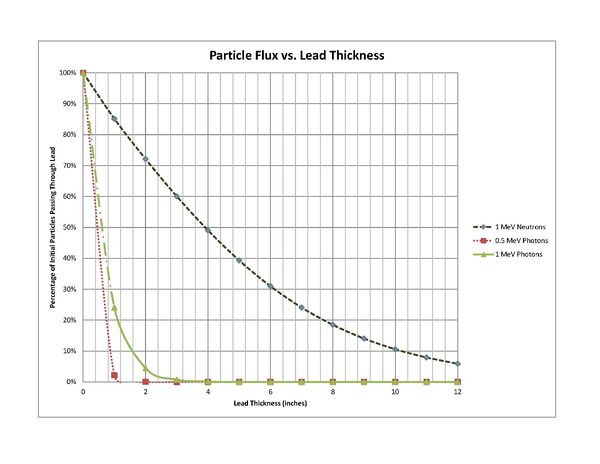
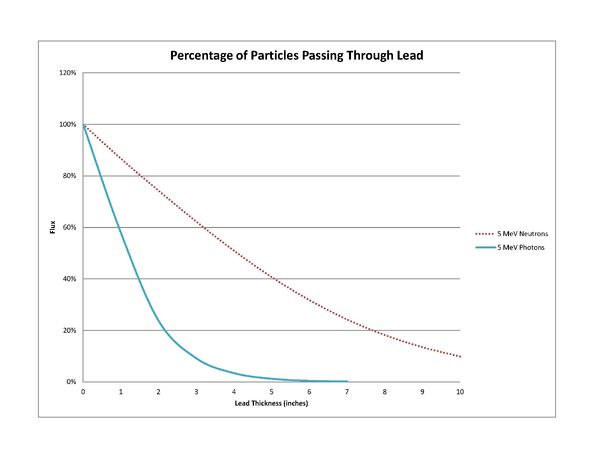
Using MCNPX, a simulation was done to determine how much of the neutrons and photons from the target will be blocked by various thickness of lead. With a monochromatic pencil beam of incident particles, the following results illustrate how much of the initial beam actually made it through the lead.
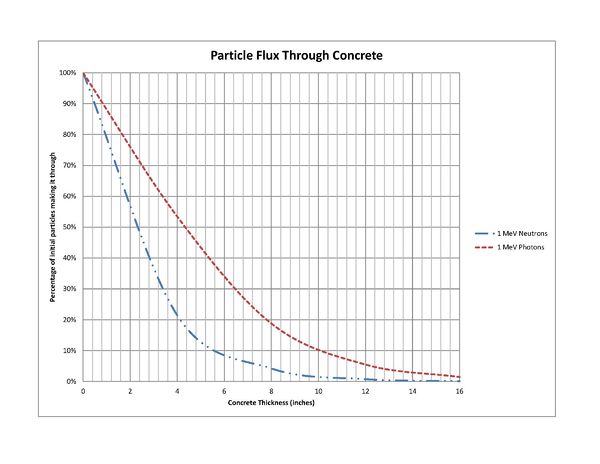
Neutron and Photon Flux Through Concrete
Detector Cross-Talk
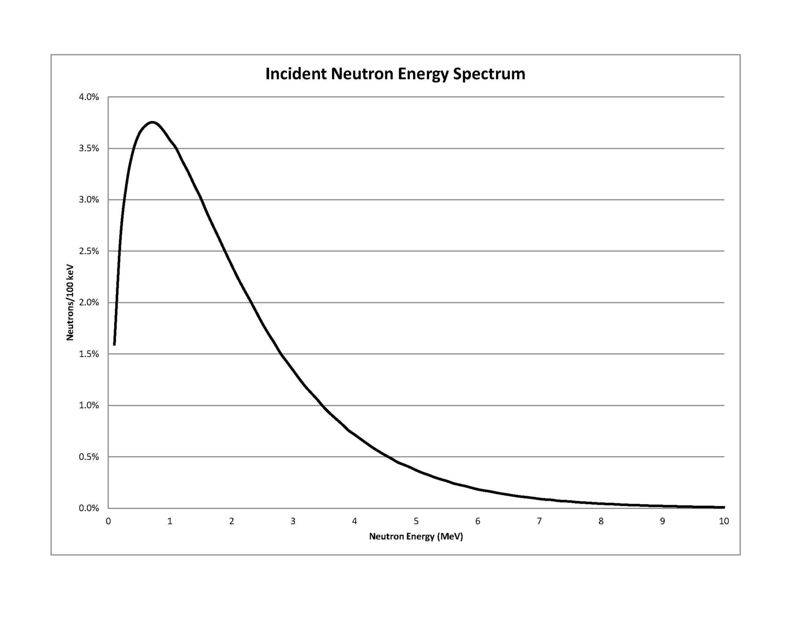
Using MCNPX, I am trying to simulated the cross-talk we could expect between the big detectors. I used a fission neutron energy spectrum given in MCNPX, shown below.
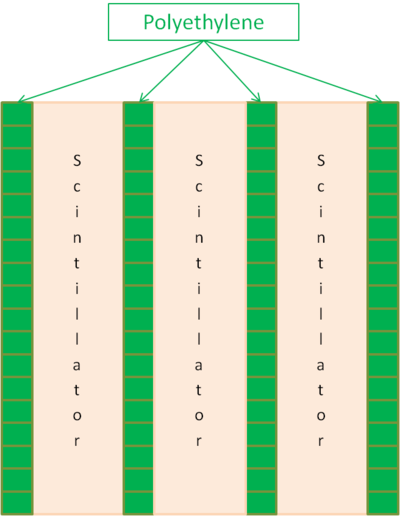
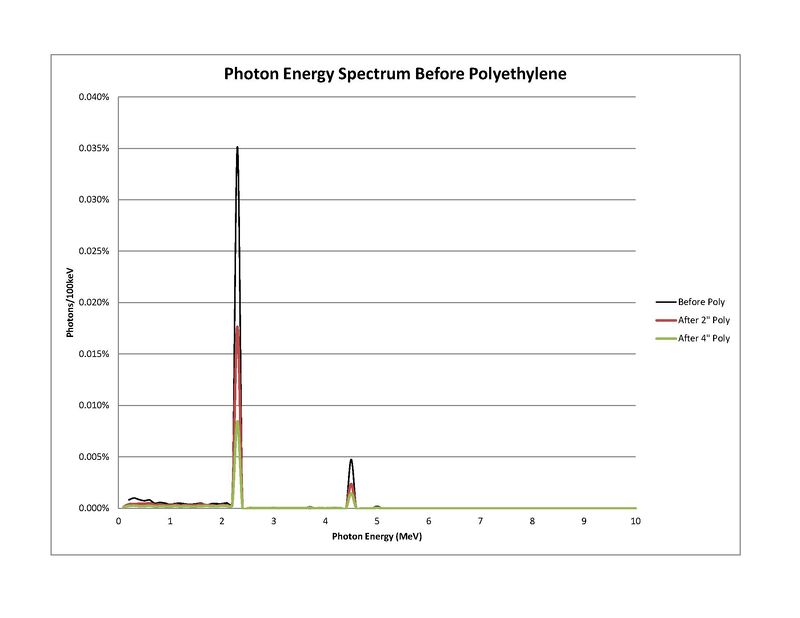
These neutrons are incident upon a plastic scintillator and I will look at the neutrons and photons coming out of the scintillator's sides perpendicular to the incident beam. The first case I will look at is where the detectors are placed with only polyethylene between them, as illustrated below.
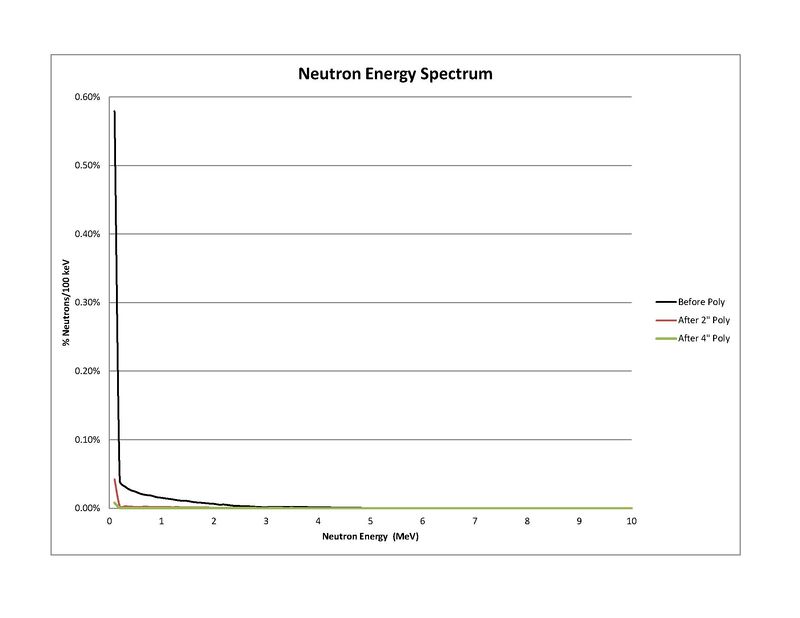
This results in a neutron and photon energy spectrum as follows.
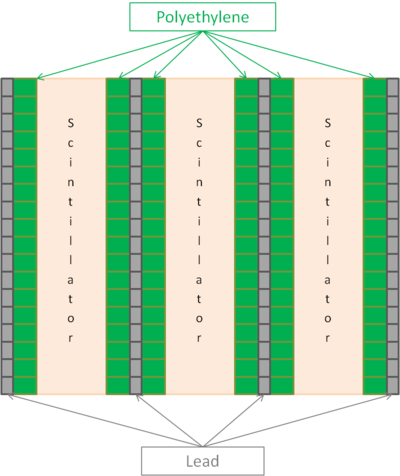
The next case I will look at is where we put a layer of lead between the polyethylene between the detectors, as shown in the schematic below.
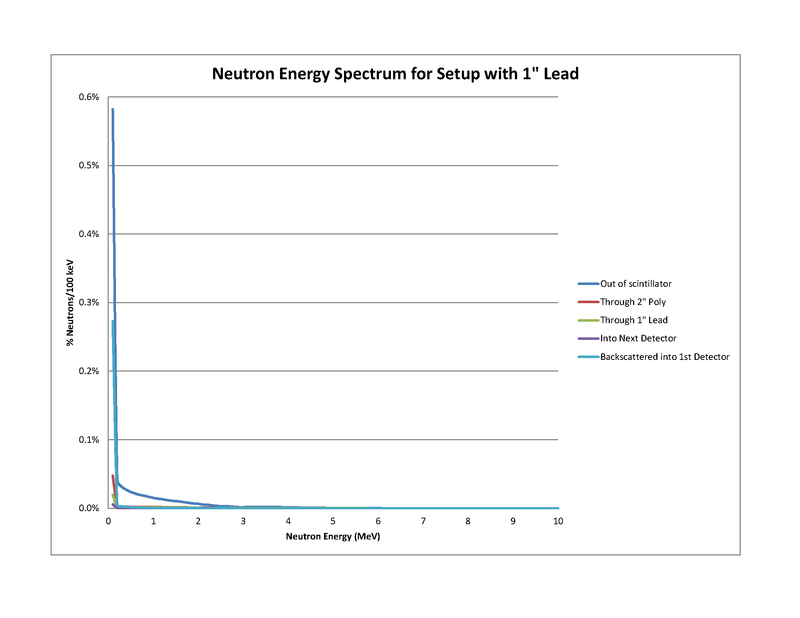
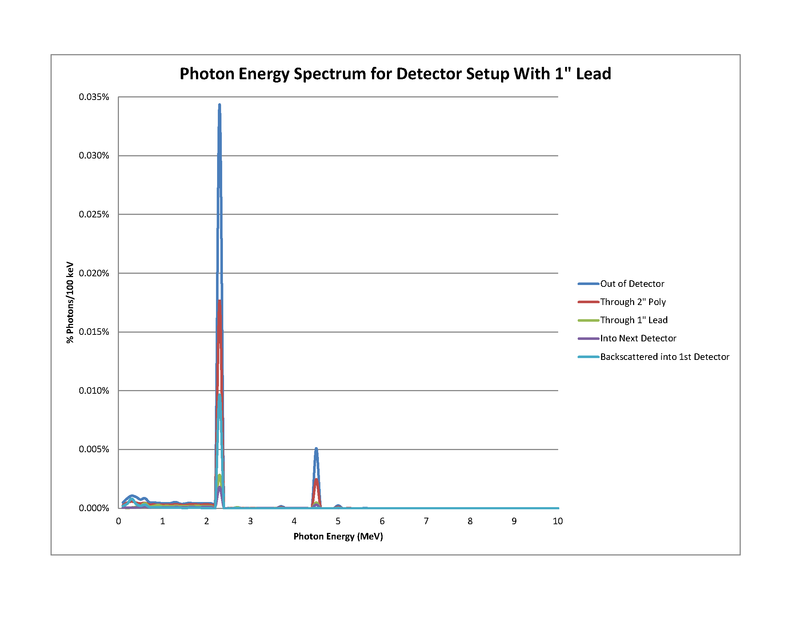
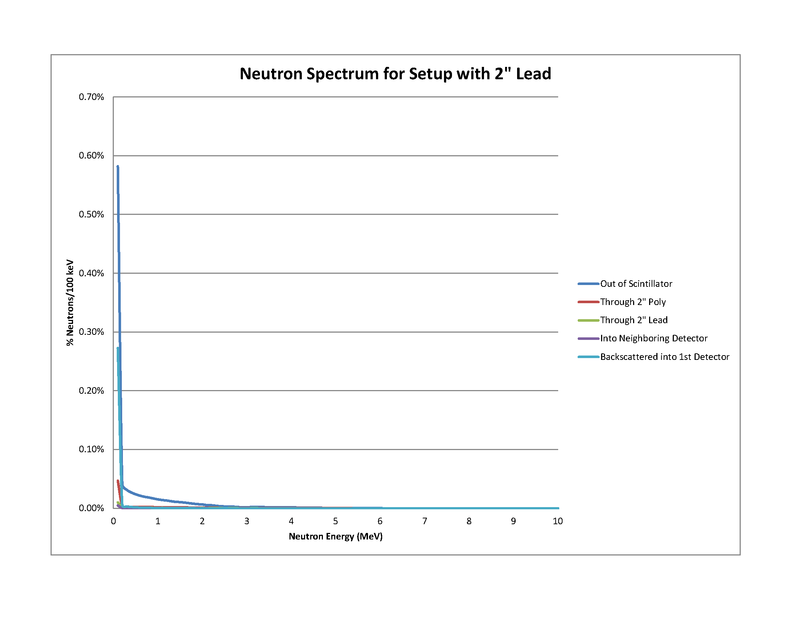
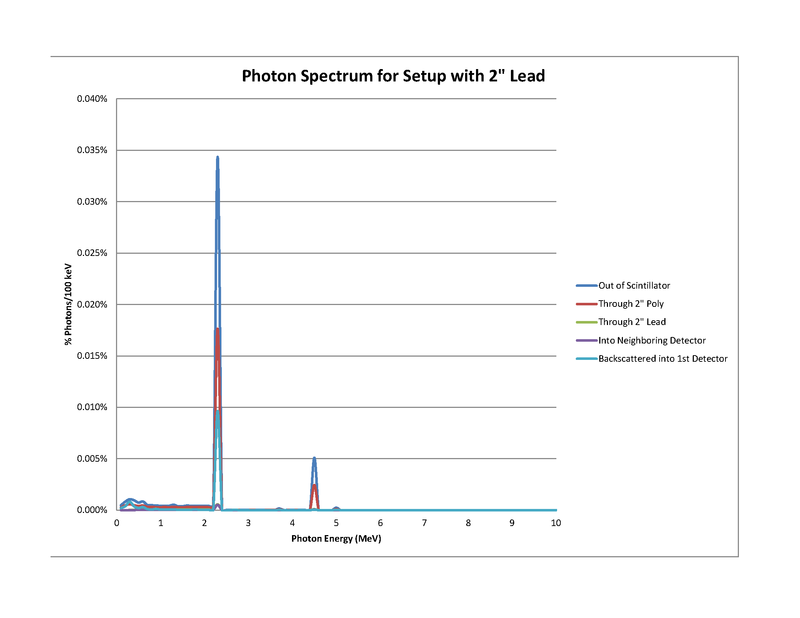
The results for this setup using 1 inch of lead between the detectors is as follows.
And, the results for this setup using 2 inches of lead between the detectors is as follows.
August 2012 HRRL Data Analysis
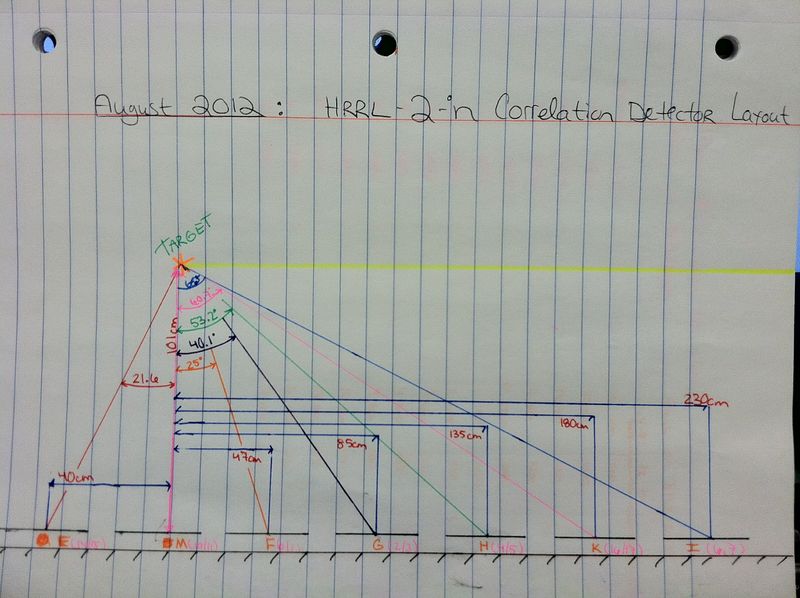
The detector measurements used for this data analysis are illustrated in the schematic below:
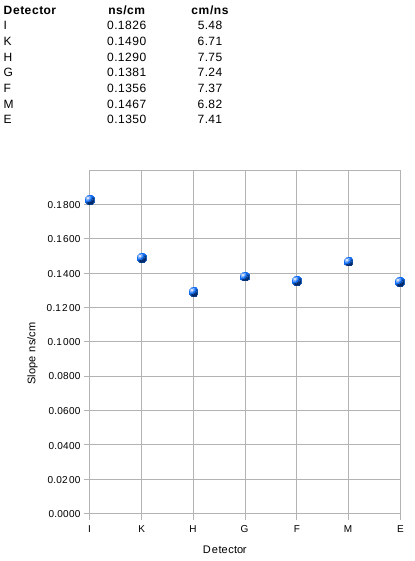
Using the index of refraction Oleksiy found:
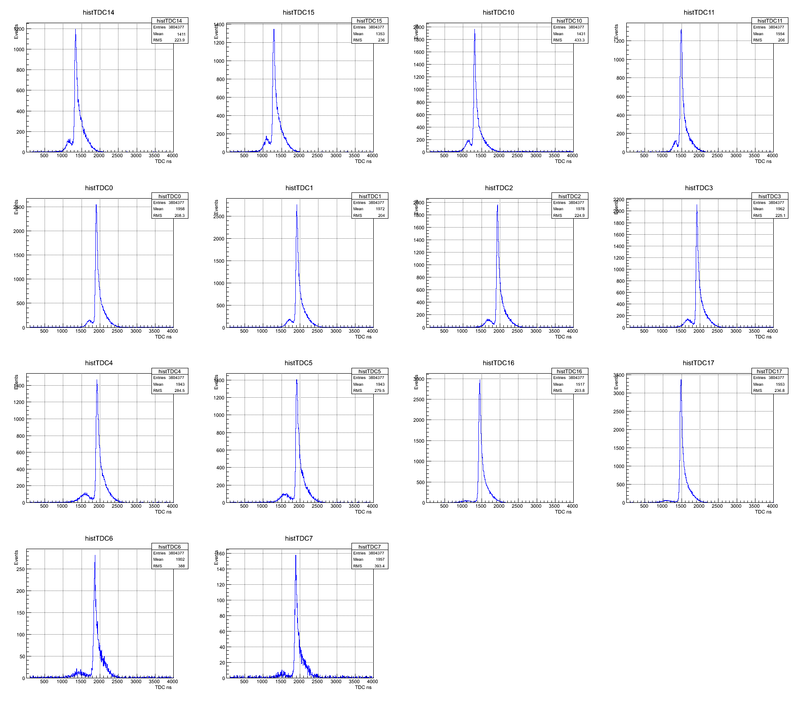
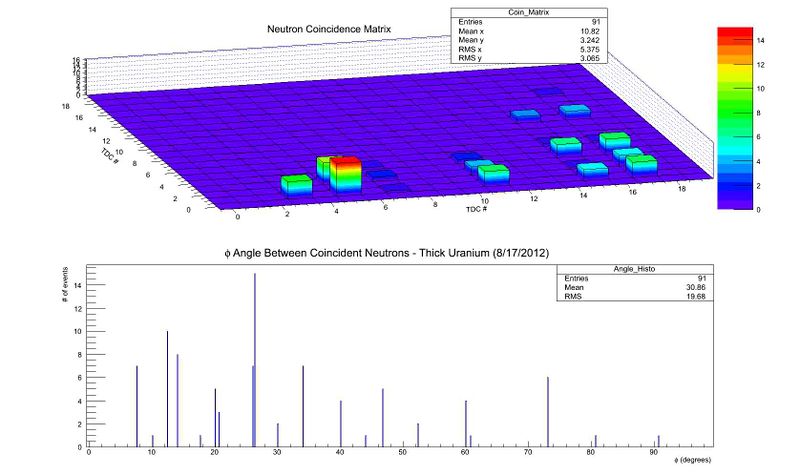
8/17
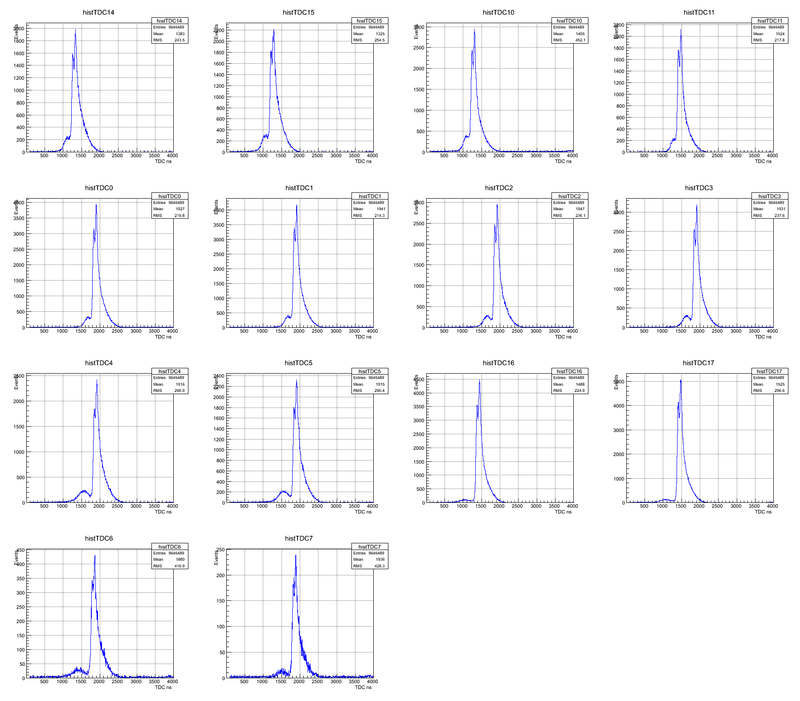
Raw Data:
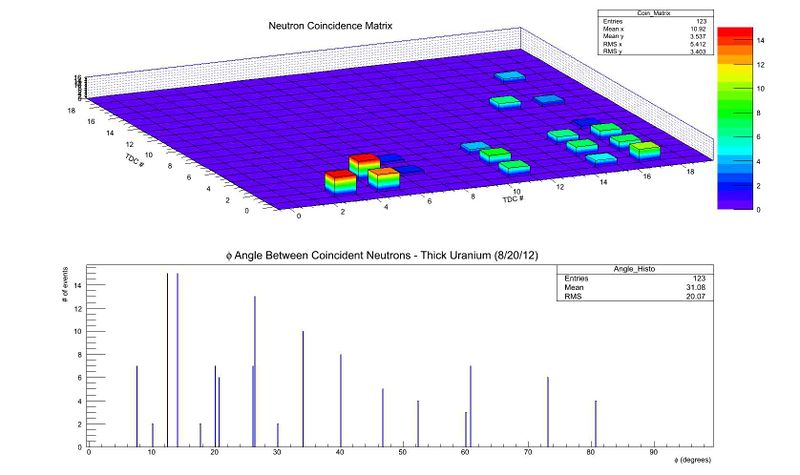
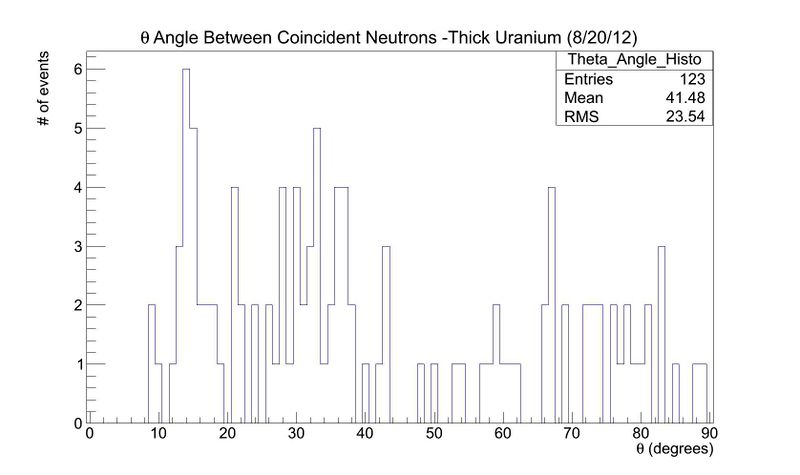
Coincidence Data:
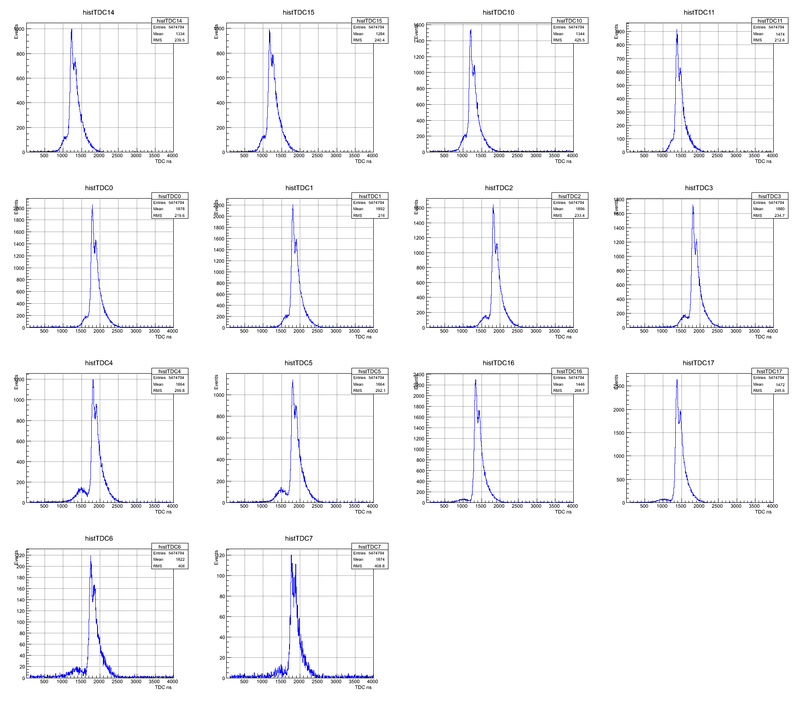
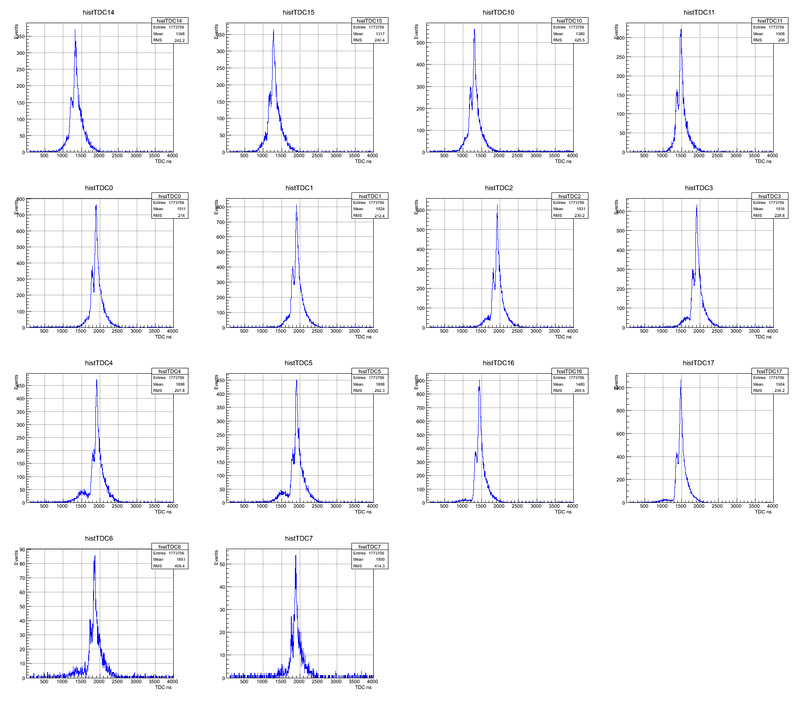
8/20
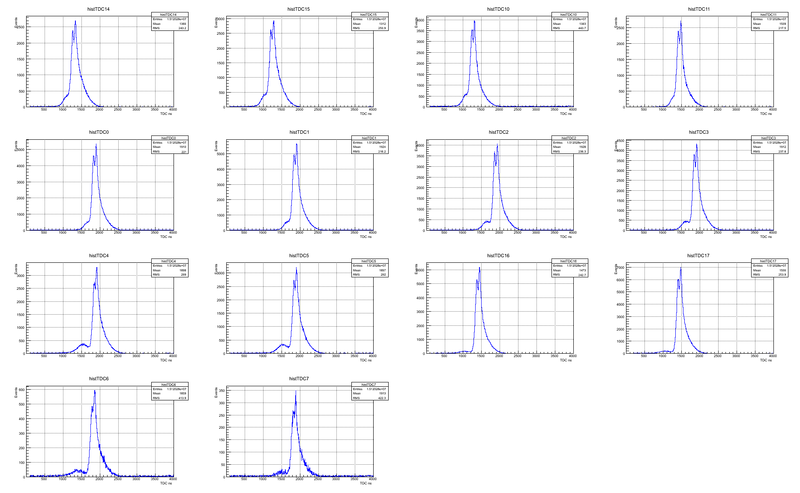
Raw Data:
Coincidence Data:
8/21
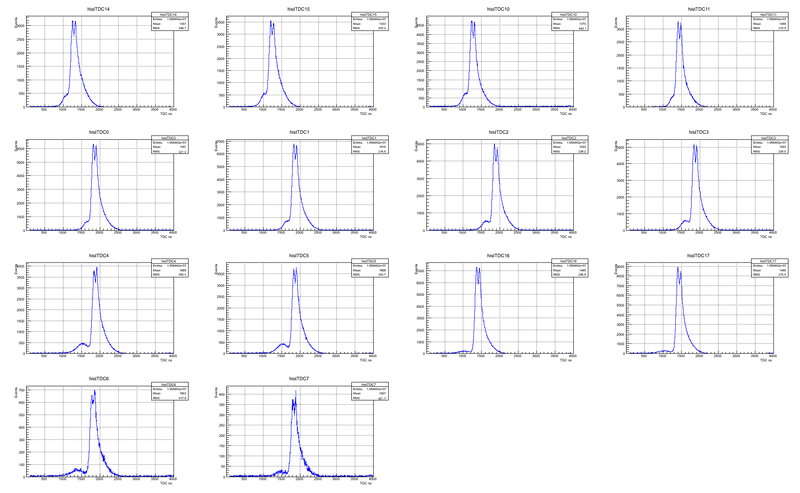
Raw Data:
4143
4144
4145
4146
8/22
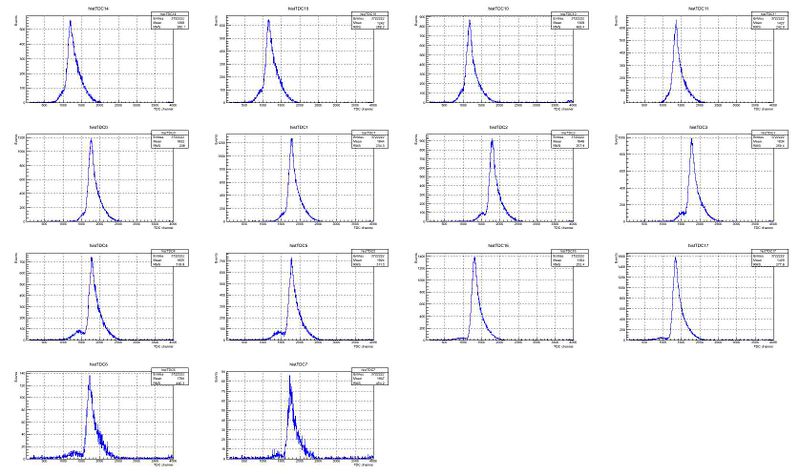
Raw Data:
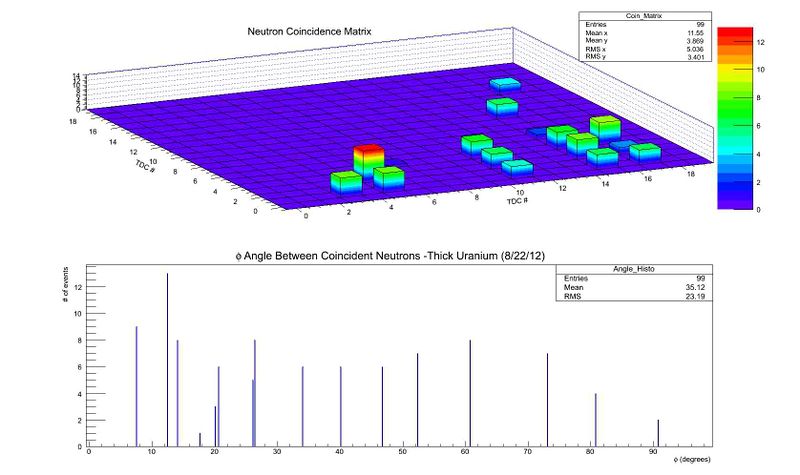
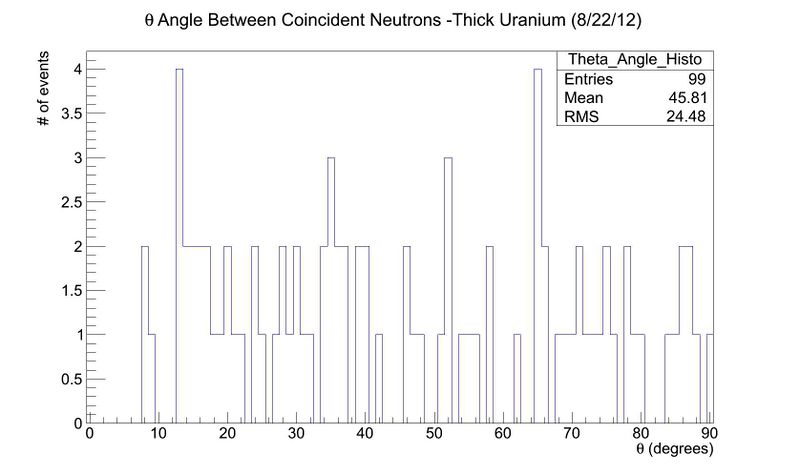
Coincidence Data:
8/23
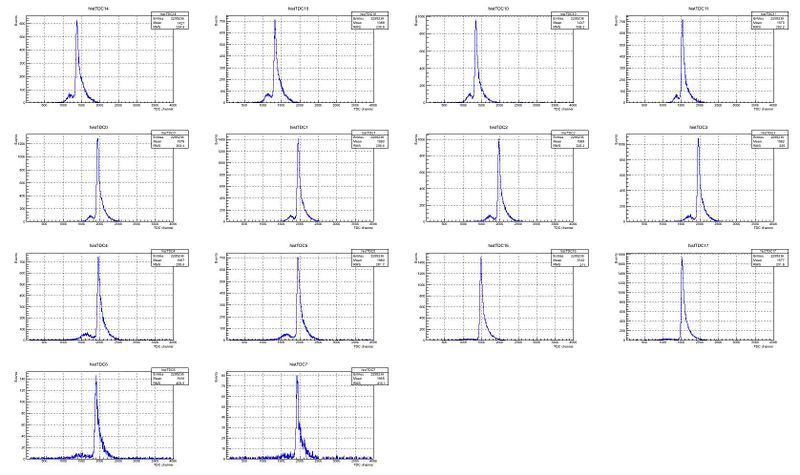
Raw Data:
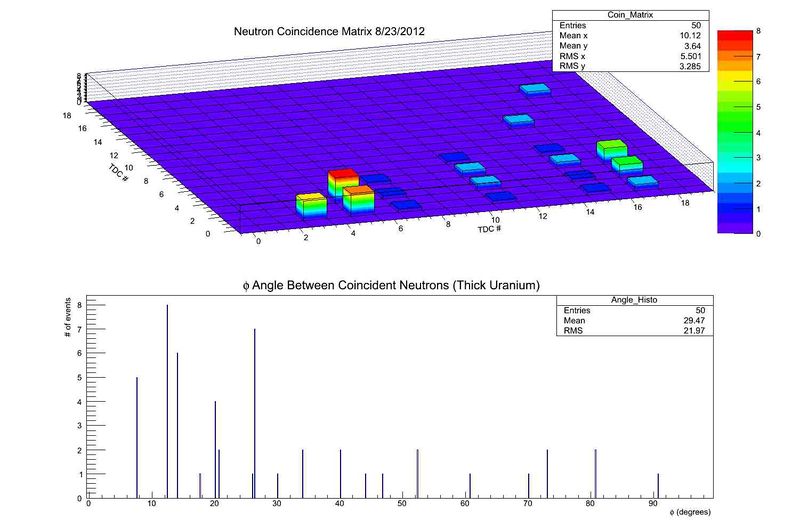
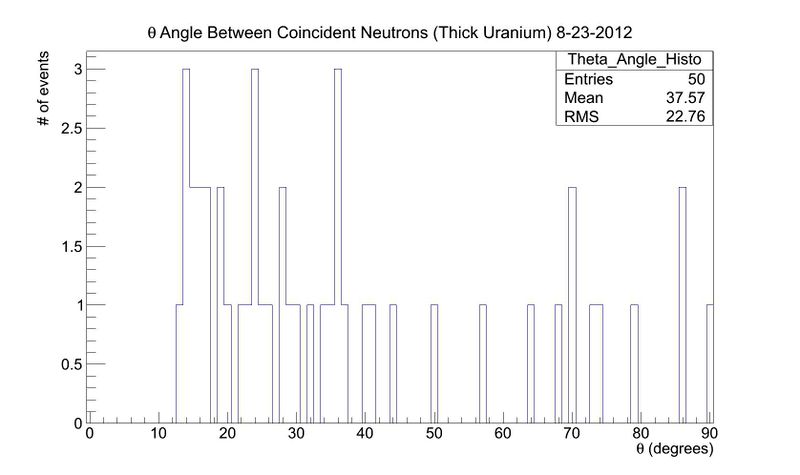
Coincidence Data:
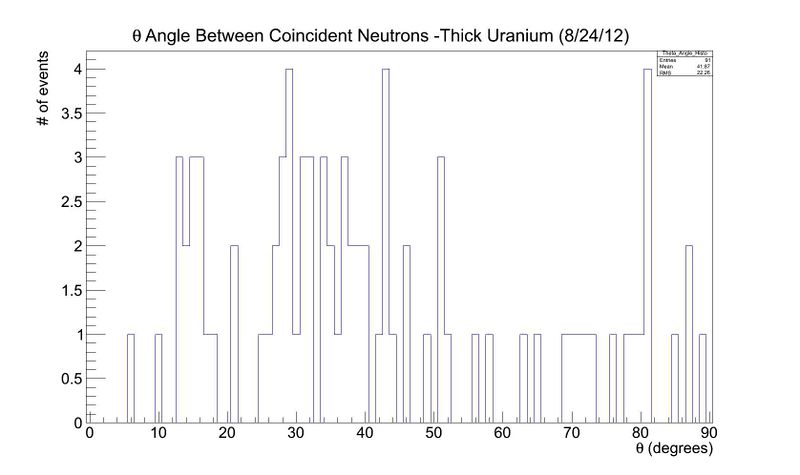
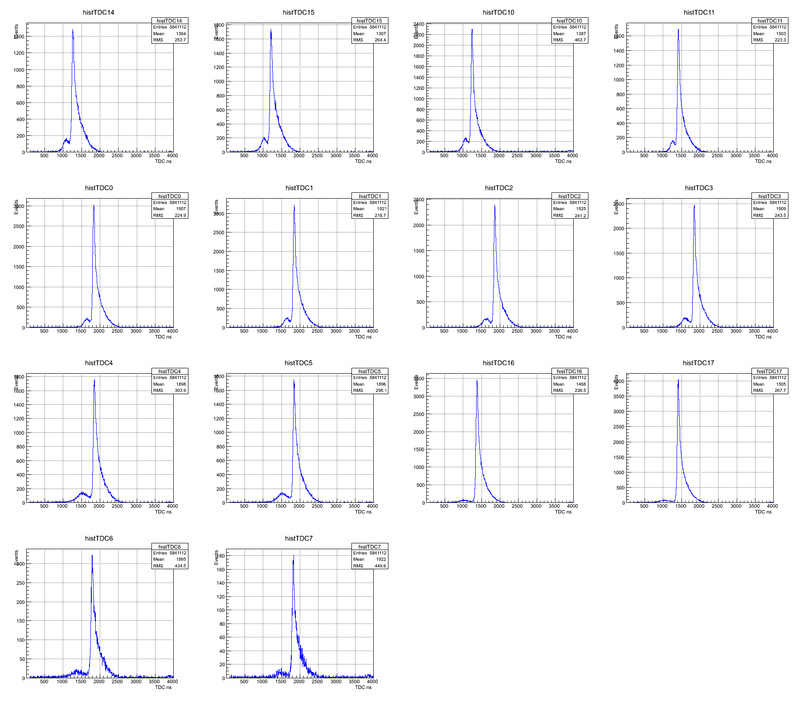
8/24
Raw Data:
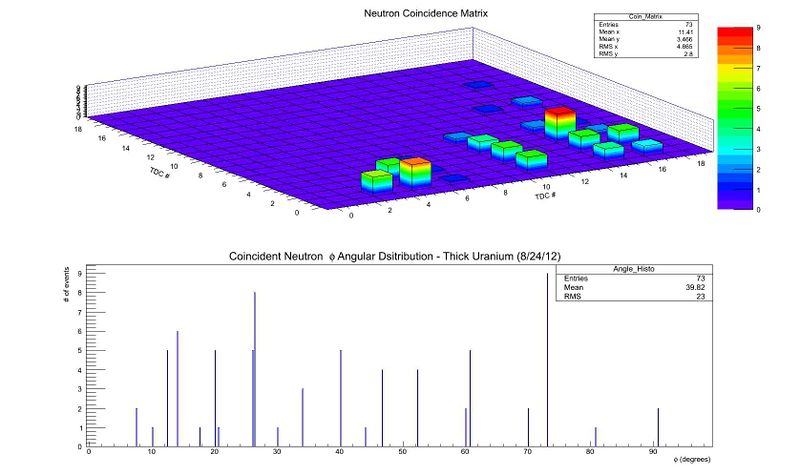
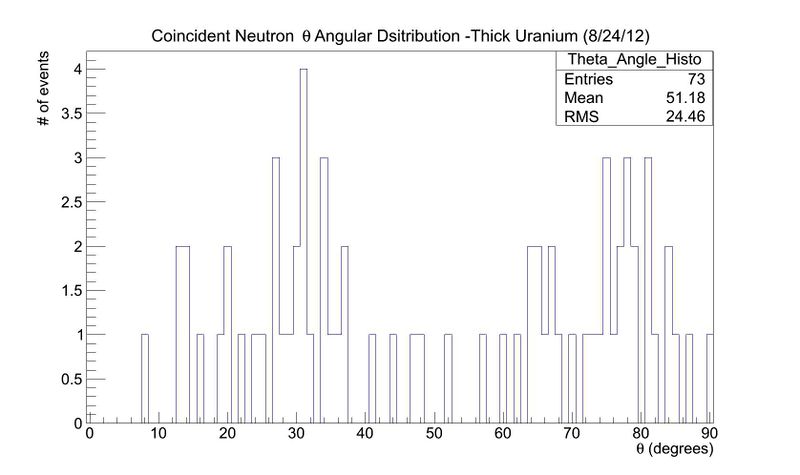
Coincidence Data:
8/17 - 8/20
8/17 - 8/21
8/17 - 8/22
