EG1BFragmentationTestTalk
Fragmentation Test
The goal of this work is to measure the fragmentation function dependence on the Bjorken scaling variable () and the four momentum transfer squared () as well as evaluate the independence of the fractional energy of the observed final state hadron (). The fragmentation function ( ) can be expressed in terms of the ratio of the difference of polarized to unpolarized cross sections for the semi inclusive deep inelastic scattering for proton and neutron targets.
Data Files
The data files from the EG1b experiment chosen for this analysis are listed below
| Run Set | Target Type | Torus Current(A) | Target Polarization | Half Wave Plane(HWP) |
| 28100 - 28102 | ND3 | +2250 | -0.18 | +1 |
| 28106 - 28115 | ND3 | +2250 | -0.18 | -1 |
| 28145 - 28158 | ND3 | +2250 | -0.20 | +1 |
| 28166 - 28190 | ND3 | +2250 | +0.30 | +1 |
| 28205 - 28217 | NH3 | +2250 | +0.75 | +1 |
| 28222 - 28236 | NH3 | +2250 | -0.68 | +1 |
| 28242 - 28256 | NH3 | +2250 | -0.70 | -1 |
| 28260 - 28275 | NH3 | +2250 | +0.69 | -1 |
| 28287 - 28302 | ND3 | -2250 | +0.28 | +1 |
| 28306 - 28322 | ND3 | -2250 | -0.12 | +1 |
| 28375 - 28399 | ND3 | -2250 | +0.25 | -1 |
| 28407 - 28417 | NH3 | -2250 | +0.73 | -1 |
| 28456 - 28479 | NH3 | -2250 | -0.69 | +1 |
| EG1b Runs used for Analysis (Run Sets, Target Type, Torus Current, Target Polarization, HWP). |
Electron-Pion separation
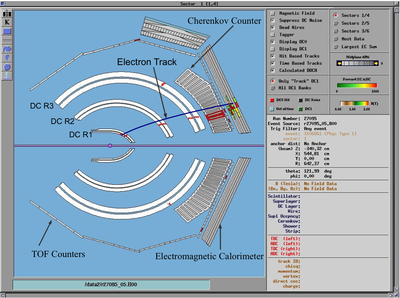
The CLAS trigger system is a coincidence of the negatively charged particle track detected in the electromagnetic calorimeter and cherenkov counter in time window. Unfortunately, a background of high energy negative pions may be misidentified as electrons. These pions are mis-identified as electrons due to quasi-real photoproduction, when the polar angle of the scattered lepton is approximately zero and is not accounted by the CLAS detector. The pion contamination of the electron sample is reduced using cuts on the energy deposited in the electromagnetic calorimeter and the momentum measured in the track reconstruction for the known magnetic field. The energy deposition mechanism for the pions and electrons in the electromagnetic calorimeter is different. The total energy deposited by the electrons in the EC is proportional to their kinetic energy, whereas pions are minimum ionizing particles and the energy deposition is independent of their momentum. The pion background is further supressed using, geometrical and time matching between the cherenkov counter hit and the measured track in the drift chamber.
EC Cuts
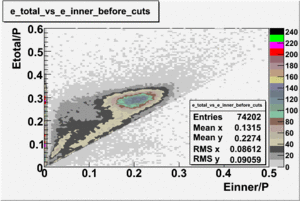
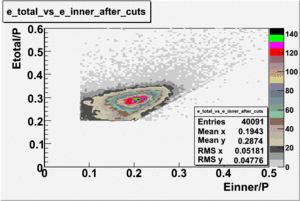
The energy deposited in the calorimeter for electrons and pions is different. Pions are minimum ionizing charged particles when their momentum is above ~ 0.8 GeV and therefore the energy they deposit in the calorimeter is momentum independent. On the other hand, electrons produce photoelectrons and generate an electromagnetic shower releasing energy into the calorimeter that is proportional to their momentum. The following cut is introduced to take advantage of this feature: . The cut was also applied to the energy collected in the inner part of the calorimeter: , because the ratio of the total energy deposited to the energy deposited in the inner calorimeter depends on the thickness of the detector and is a constant.
| vs before and after EC cuts (, for EC inner - ). After applying EC cuts about 46 % of the events have been removed from the electron sample. |
Cherenkov Cuts
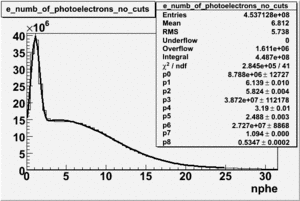
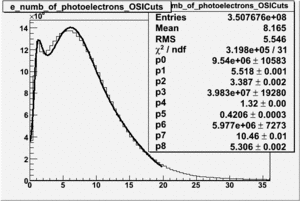
In addition to the cut on the energy deposited into the electromagnetic calorimeter, misidentified electrons are reduced by requiring a signal in the threshold CLAS Cherenkov detector. Pion's misidentified as electrons have been shown to produce around ~1.5 photoelectons (PEs) in the Cherenkov detector, as shown below. Geometrical cuts on the location of the particle at the entrance to the Cerenkov detector were applied to reduce the pion contamination. The second histogram below shows that, after these cuts, the peak around 1.5 PEs is substantially reduced. It appears, that pion contamination in electron sample is before applying the hard cut on the number of photoelectrons produced in the cherenkov counter and after cut contamination is about .
| The number of photoelectrons before and after OSI Cuts. |
SIDIS Analysis
Inclusive Electron Detection Efficiency
|
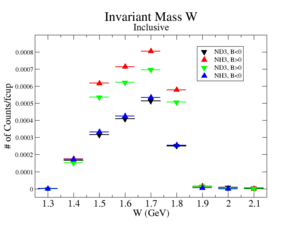
| A comparison of the Inclusive electron rates observed in the scintillator paddles that will be used to reconstruct electrons for SIDIS events. |
Ratios of the inclusive electron rate, normalized using the gated faraday cup, of scintillator paddles 5 and 10 were measured. The two ratios are constructed to quantify the CLAS detectors ability to observe the same electron kinematics in scintillator paddle #5 for a positive Torus polarity and scintillator #10 using the negatie Torus polarity.
Notice the above ratios are statistically the same. The semi-inclusive analysis to be performed in this thesis will be taking ratios using an ND3 and and NH3 target. Below is the observed ratio comparing the inclusive electrons observed in scintillator #5 for a positive torus polarity and ND3 target to the electrons observed in scintillator #10 when the torus polarity is negative and the target is NH3.
The above ratios, which have been observed to be ammonia target independent, indicate a difference in an electron detector efficiency when the Torus polarity is flipped. An electron detection efficiency "correction coefficient" is defined in terms of the above ratio and measured to be and . The impact of these corrections on the data is illustrated in the next section.
Exclusive Event Reconstruction Efficiencies
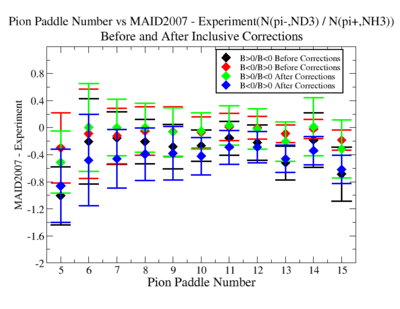
The MAID 2007 model has predictions of the total cross section for the following two cases, that are related to our work:
| + proton + neutron |
| + neutron + proton |
|
| The difference between the measured to exclusive ratio to the ratio predicted by MAID 2007. |
One can conclude from the above Figure that the inclusive corrections do not impact a single pion production for the exclusive cases.
Asymmetries
The double spin asymmetry measurements in this thesis are performed by comparing scattering events that occur when the incident probe spin and nuclear target spin are parallel to the scattering events that occur when the spins are anti-parallel.
Beam Charge Asymmetry
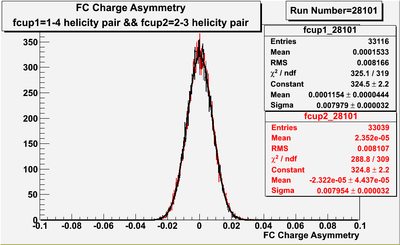
The Faraday cup signal recorded by the gated helicity scaler is used to normalize the events reconstructed during the same helicity interval. The beam charge asymmetry measured by the gated helicity scaler is shown below for 28210 run number. At the end foor each run number the gaussian fit was used to extract the mean values of the asymmetry and corresponding error
| Beam charge asymmetry for run #28101 using the gated faraday cup counts for two helicity pairs(1-4 and 2-3 helicity pairs). and . |
Electron Asymmetry
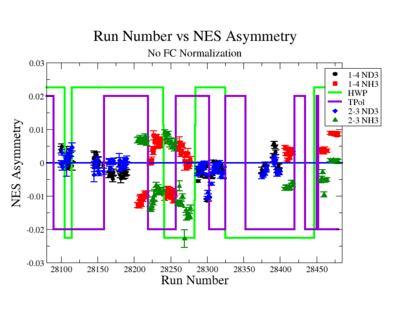
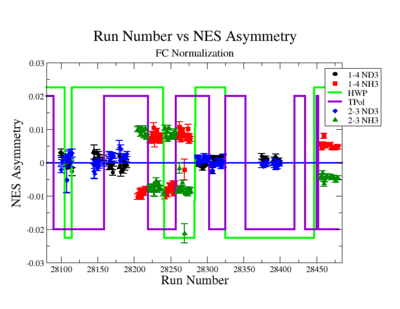
A measurement of the electron cross section helicity difference needs to account for the possible helicity dependence of the incident electron flux ( Charge Asymmetry). Figures below show the reconstructed electron asymmetry before and after it is normalized by the gated Faraday Cup as a function of the run number for the 4.2 GeV data set. The reconstructed electron asymmetry can be defined following way:
| or |
where () represents number of reconstructed electrons in the final state for the positive(negative) beam helicity.
| Run Number vs Electron Asymmetry before and after FC normalization. The red points represent reconstructed electron asymmetry for the helicity 2-3 pair and the black points - the helicity pair 1-4. The green line shows the sign of the half wave plane(HWP) and the purple line - the sign of the target polarization(TPol). |
The electron asymmetries for each target type, before and after FC normalization are listed below
| Run Group | Target Type | Before FC | After FC |
| ND3 | 0.12 % | 0.11 % | |
| -0.06 % | -0.09 % | ||
| NH3 | 0.61 % | 0.72 % | |
| -0.78 % | -0.73 % |
| Electron Asymmetries for NH3 and ND3 targets before and after FC Normalization . |
Semi-Inclusive Asymmetry
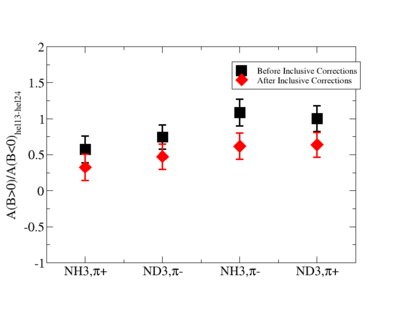
he ratio of the combined semi-inclusive deep inelastic asymmetries (), for two different torus settings have been corrected for the inclusive corrections. The Figure below represents asymmetry ratios before and after inclusive corrections. The ratios have been calculated for each target and charged pion type. SIDIS asymmetries are statistically the same. The results suggest inclusive corrections do not make significant change on the asymmetries.
| The ratio of the SIDIS asymmetries for two torus field settings vs target and the charged pion type. The black squares represent the data before inclusive corrections and the red data - after inclusive corrections has been applied. |
The data has been subdivided for the Bjorken scaling variable() and the fraction energy of the observed final state pion(). asymmetries for three are shown below.
| 0.45 | ||
| 0.7 | ||
| 0.9 |
| SIDIS Asymmetries vs . |
