Sadiq Proposal Defense
Abstract
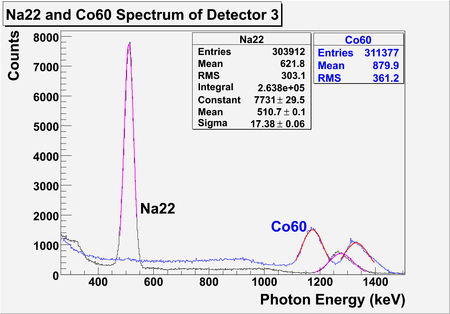
We are constructing a achromatic positron source in the Beam Lab of Department of Physics at Idaho State University. We have studied the radiation impact of moving the cavity to new location, with GEANT4 simulation and experiment. Our conclusion was it was safe to do so. We Constructed new beamline, performed emittance measurements, and we calculated emittance and twiss parameters. We acquired 4 NaI crystals from Idaho Accelerator Center (IAC). We built our own PMT bases for them by modifying one the design. NaI detectors with new base are tested and they worked properly. A tungsten target will be placed in a chamber between 1st and 2nd triplet. The dipole magnet was remapped for emittance test with energy scan. We are expecting to collect positrons and transport them down the second positron annihilation target at the end of the 90 degree beamline. Two NaI detectors in opposite side will detect 511 keV photons created from annihilations, which will tell us the efficiency of the positron generation.
Introduction
We want to measure the efficiency of producing positrons using the High Repetition Rate Linac (HRRL) located at the Beam Lab of the Physics Department, at Idaho State University (ISU). HRRL S-band electron linear accelerator, with max beam energy of 16 MeV, max peak current of 80 mA, max repetition rate of 1 kHz, and max pulse length of 250 ns (FWHM).
The Beam Lab is, located in the basement of the physics department, divided into two parts by a L-shaped cement wall. The accelerator cell houses the cavity and magntic elements needed to transport electrons. The experimental cell is located in an adjacent room to the accelerator cell. Previously cavity was located at the center of the accelerator cell. To adapt positron project, it was relocated closer the walls, which allow us to add more dipole and quadrupole magnets.
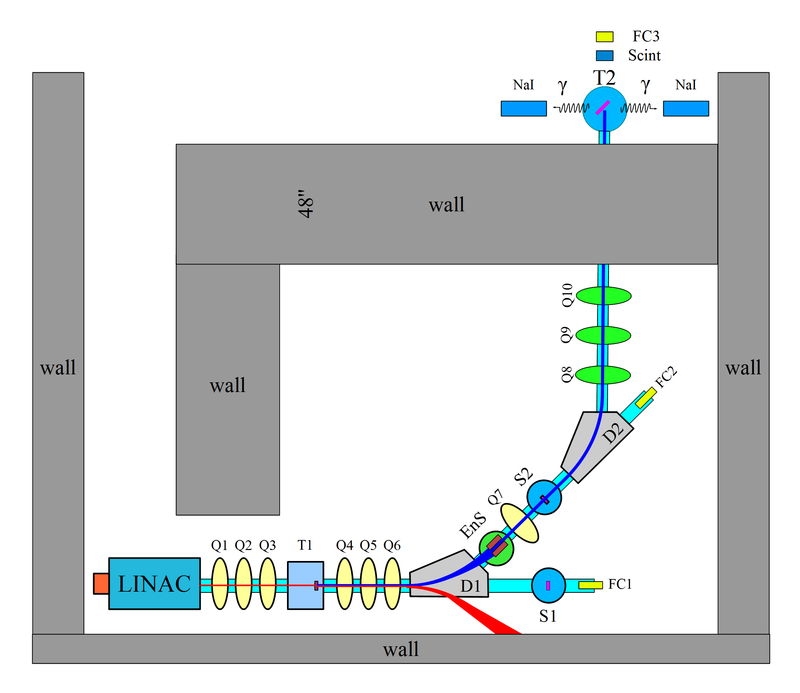
In the new beanline, the electron beam comes out of HRRL cavity will pass through first set of quadruple triplet magnets, which is going to focus electron beam on the positron target. Positrons created in the target will be collected by second set of quadruple triplet, then will be bent 45 degree by first dipole magnet. We want to insert or removed positron target from beamline, so that we can run in positron or electron dual mode. Accordingly, we will change the polarity of the dipoles to run on e-/e+ modes. The The second dipole will bend beam another 45 degree, thus complete total of 90 degree bend. Third set of quadruple triplet will be used create desired e-/e+ beam profile sutable for users' need.
This is the setup and apparatus we want run for positron creation and collection for the future.
| Item | Description |
| T1 | Positron target |
| T2 | Annihilation target |
| EnS | Energy Slit |
| F1, F2, F3 | Flang |
| FC1, FC2 | Faraday Cup |
| Q1,...Q10 | Quadrupole |
| D1, D2 | Dipole |
| NaI | NaI Detecotrs |
| OTR | OTR screen |
| YAG | YAG screen |
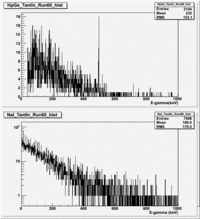
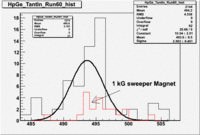
Earlier measurements were conducted at Idaho Accelerator Center of ISU. Setup are shown in figure below. 511 photons from annihilation are detected.
| Item | Description |
| Tantalum Foil | 6 mm thick 20 mm x 20 mm area |
| Tungsten Foil | 2 mm thick 20 mm x 20 mm area |
| Phosphorus Flag | 1 mil aluminum backing |
| Media:HpGe_Crystal_GEM-60195-Plus-P.pdf | 81.3mm Diameter, 55.5mm Length |
| NaI detector |
Experiments
HRRL Emittance measurements
Emittance is an important parameter in accelerator physics. If emittance with twiss parameters are given at the exit of the gun, we will be able to calculate beam size and divergence any point after the exit of the gun. Knowing the beam size and beam divergence on the positron target will greatly help us study the process of creating positron. Emittance with twiss parameters are also key parameters for any accelerator simulations. Also, energy and energy spread of the beam will be measured in the emittance measurement.
What is Emittance
In accelerator physics, Cartesian coordinate system was used to describe motion of the accelerated particles. Usually the z-axis of Cartesian coordinate system is set to be along the electron beam line as longitudinal beam direction. X-axis is set to be horizontal and perpendicular to the longitudinal direction, as one of the transverse beam direction. Y-axis is set to be vertical and perpendicular to the longitudinal direction, as another transverse beam direction.
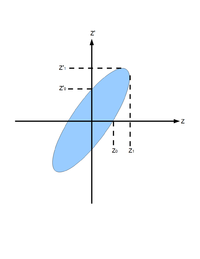
For the convenience of representation, we use to represent our transverse coordinates, while discussing emittance. And we would like to express longitudinal beam direction with . Our transverse beam profile changes along the beam line, it makes is function of , . The angle of a accelerated charge regarding the designed orbit can be defined as:
If we plot vs. , we will get an ellipse. The area of the ellipse is an invariant, which is called Courant-Snyder invariant. The transverse emittance of the beam is defined to be the area of the ellipse, which contains 90% of the particles <ref name="MConte08"> M. Conte and W. W. MacKay, “An Introduction To The Physics Of Particle Accelera tors”, World Scientifc, Singapore, 2008, 2nd Edition, pp. 257-330. </ref>.
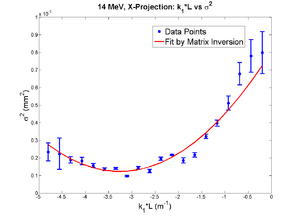
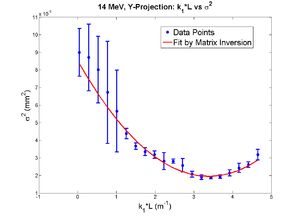
By changing quadrupole magnetic field strength , we can change beam sizes on the screen. We make projection to the x, y axes, then fit them with Gaussian fittings to extract rms beam sizes, then plot vs vs . By Fitting a parabola we can find constants ,, and , and get emittances.
Emittance Measurement Using a YaG crystal
In July 2010y, Emittance measurement of HRRL was conducted at Beam Lab, at Physics Department of ISU. We installed a YAG crystal on the HRRL beam line to see electron beam. A quadrupole magnet was installed between HRRL gun and the YAG screen. We changed current on the quadrupole to control magnetic field strength of the quadrupole magnet, thus we changed electron beam shape on the YAG screen.
Experimental Setup
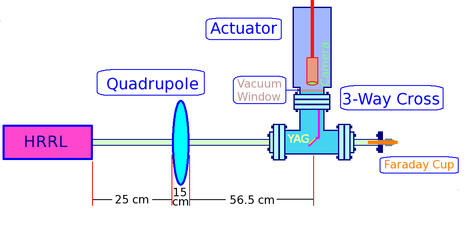
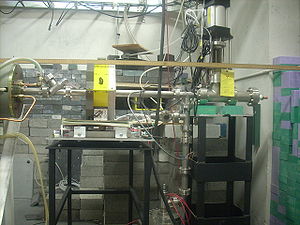
We did quadrupole scan to measure emittance of the electron beam in HRRL. In quadrupole scan method, the strength of the quadrupole magnet was changed by changing the current go through quadrupole coils. The electron beam were coming out of the gun went through quadrupole, then beam would enter a 3-way cross. Two end of the 3-way cross was installed on the beam line. The third end of the 3-way cross was placed upward and there was a actuator installed to it. The YAG crystal was mounted in the actuator, which can put the YAG in the beam line or take it out of the beam line. A camera was placed inside the actuator to look through vacuum a window and to capture the image on the YAG crystal created by electron beam. A Faraday cup was mounted at the end of the beam line to measure the transmission of the charge.
Setup and beam line and are shown in figures 1.2 and 1.3:
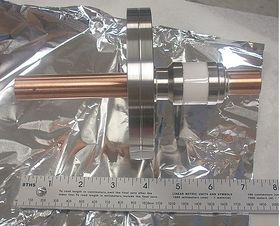
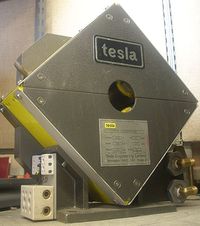
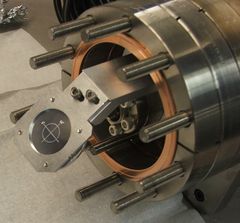
Figures 4, 5, and 6 show Faraday cup, Quadrupole Magnet, and YAG Chrystal used in the test:
Emittance measurement was carried out on HRRL on July of 2010 under the experimental setup discussed in previous section. In this measurement we used analog camera to take images.
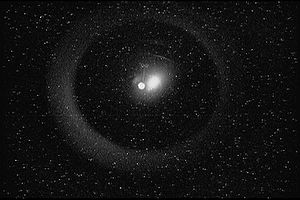
When relativistic electron beam pass through YAG target, Opitcal Transition Radiation (OTR) is produced. OTR are taken for different quadrupole coil current (0-20 A).
Data Analysis
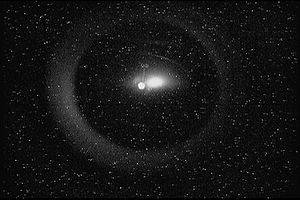
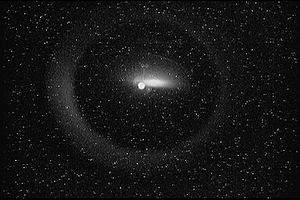
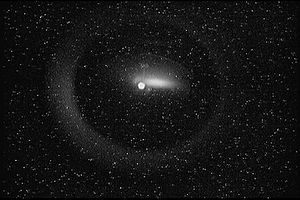
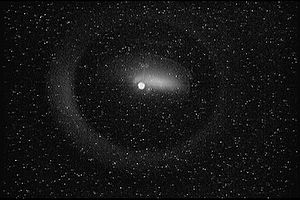
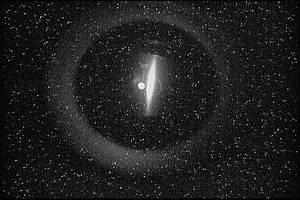
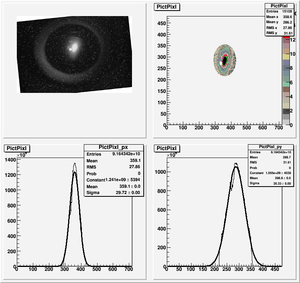
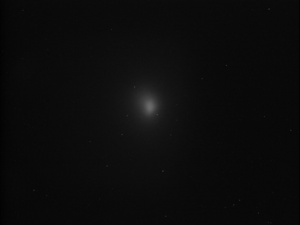
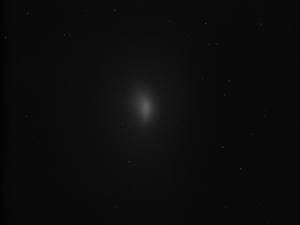
In the mages we can see a bright spot at the center. This spot did not change by changing quad coil current. So, this is image of hot filament. The bigger spot at the right side of the filament was changing by changing quad coil current, hence it is OTR. We also see 10 mm circle mounted on the OTR target, as well as beam hallow.
We did Guassian fits to beam image to extract x, y RMS values for different quad currents. We discovered that the camera was rotated slightly. To compensate for images were rotated, so that we have beam image upright. To reduce back ground, we just focused on OTR beam image and took out the filament spot from data, as shown in image below.
Results
Emittance Measurements with an OTR
During first emittance measurement, we see our electron beam image at YAG crystal is much bigger than expected. Comparison study shows that for same beam YAG screen shows bigger beam size than Optical Transition Radiation (OTR) screen. Yag is good for low charge beam. Electron beam from HRRL has a big charge in a single pulse and beam size is big.
We did out second emittance measurement with 10 thick aluminium OTR screen. We also improved our optical imaging system by using better digital camera that can be triggered by the same pulse trigger electron gun and also by using three 2 inch diameter lenses to focus the lights from OTR to the CCD of the camera.
Experimental Setup
The cavity was moved the new location and beam line was built by the design of Dr. Yujong Kim, as shown in figure
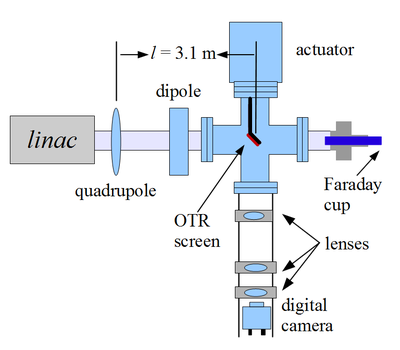
Experimental setup is shown in the following figure
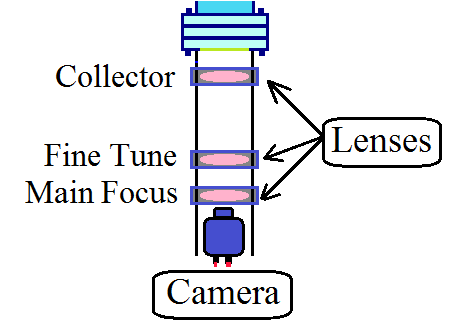
We chose one of the quad at a time to do the scan and turned off all the other quads. Optical transition radiation was observed at OTR target. At the end of 0 degree beamline we have a Faraday cup to measure the charge of the beam. Camera cage system was located below the OTR target. There are 3 lenses used to focus lights from target to the CCD camera. Target can be pushed into or taken out of the beamline by the actuator at the top.
We chose one of the quad at a time to do the scan and turned off all the other quads. Optical transition radiation was observed at OTR target. At the end of 0 degree beamline we also have a Faraday cup to measure the charge of the beam.
OTR Target can be pushed into or taken out of the beamline vertically by the actuator at the top, which is attached to the 6-way cross. This actuator controlled remotely at the control desk.
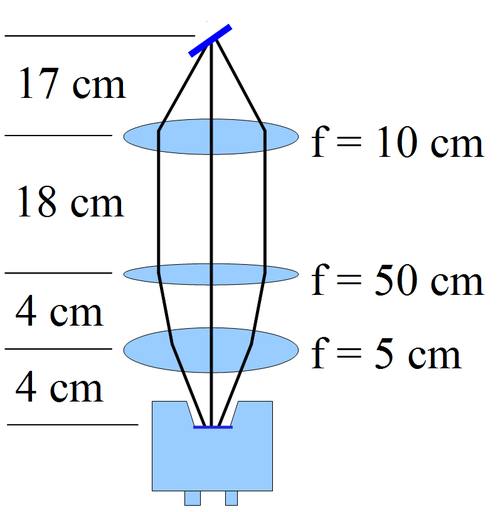
Camera cage system was located below the OTR target. Cage system attached to the bottom of the 6-way cross, and where there is a transparent window. There are 3 lenses used to focus lights from target to the CCD camera. They have focal length of 100 mm, 500 mm, and 50 mm.
The lens closest to the OTR target is 10 cm away from the target, an it has 100 mm focal length. This lens was located as close to the target as possible, so that we might collect as much OTR light as possible, and it was thus called collector lens. The lens in the middle has focal length of 500 mm. Moving this lens will change total focal length in a small amount, and this allow us to do fine tuning. Thus, we called this lens fine tuning lens. The last lens, which is furthest from target, and closed to the CCD camera has the shortest focal length of 5o mm. Its short focal length allow us to focus the light on the very small sensing area of the CCD camera.
Experiment with OTR
Optical Transition Radiation (OTR): Transition radiation is emitted when a charge moving at a constant velocity cross a boundary between two materials with different dielectric constant.
Emittance measurement was carried out on HRRL on March of 2011 under the experimental setup discussed in previous section. In this measurement we used JAI digital camera.
When relativistic electron beam pass through Aluminum target OTR is produced. OTR are taken for different quadrupole coil currents.
Data Analysis and Results
The projection of the beam is not Gaussian distribution. So, we fit Super Gaussian fitting <ref name="BeamDisBeyondRMS"> F.-J Decker, “Beam Distributions Beyond RMS”, BIW94, Vancouver,CA,Sep 1994, . </ref>.
We used the MATLAB to analyze the data. The results shows that:
Beamline parameters for optimal positron production using the measured emmittance
Positron Detection using NaI crystal
To detect positrons created, we want a put Tungsten target at the end of 90 degree beamline. When positrons hit W-target, 511 keV photons will be created. We want to use NaI detectors to detect these 511 keV photons, so we might have an estimate on the numbers of the positrons we collect at the end of the 90 degree beamline.
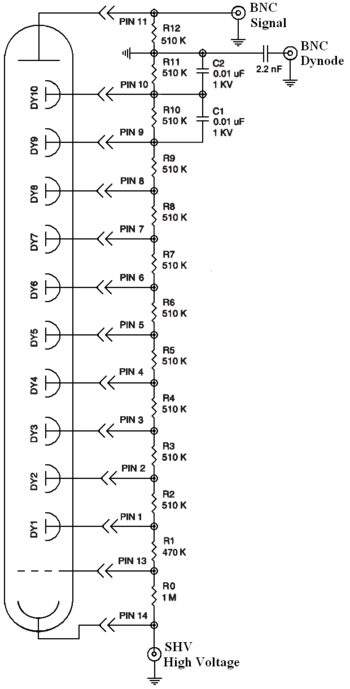
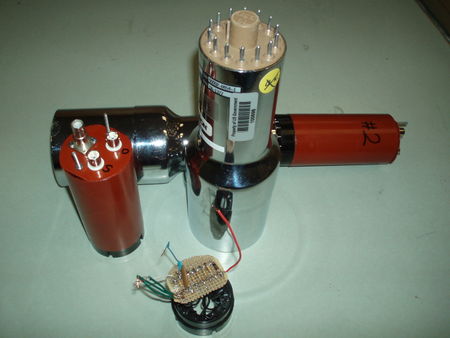
We acquired some NaI crystals from Idaho Accelerator Center (IAC). We built our own PMT bases for them, since the bases we had not working properly. We modified the design of model PA-14 from Saint-Gobain crystals & detectors ltd. Following image is the design.
Future Plan
Positron Target
A tungsten target will be placed in the space between 1st and 2nd triplet. The tungsten target will be placed inside a big chamber.
We are going to run
Emittance Tests with Energy Scan
We will do emittance test with precise energy scan. We remapped dipole magnet for more precise energy scan. This will also improve our emittance measurement.
Positron Yield
We will insert the first tungsten target and create positrons. We are expecting to collect part these positrons and transport them down the second tungsten target at the end of the 90 degree beamline. By doing these, 511 keV photons will be created and we want to detect them by our NaI detectors.
References
<references/>
