Qweak Delta
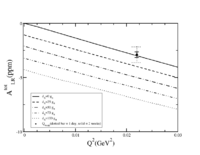
Expected results
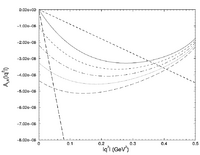
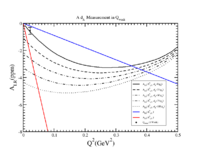
The above Figure in EPS format :File:D Delta Qweak Error.eps
File:A d-delta-vs-Q2.xmgrace.txt
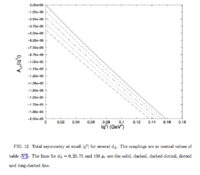
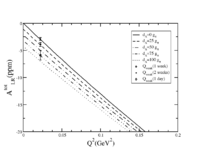
The above Figure in EPS format :File:Atot d Delta Qweak Error.eps
File:Atot d-delta-vs-Q2.xmgrace.txt
Media:PCS_Report_4_LOI-03-105.pdf
File:Shi-Lin Zhu hep-ph-0107076 2001.pdf
first Inelastic Data
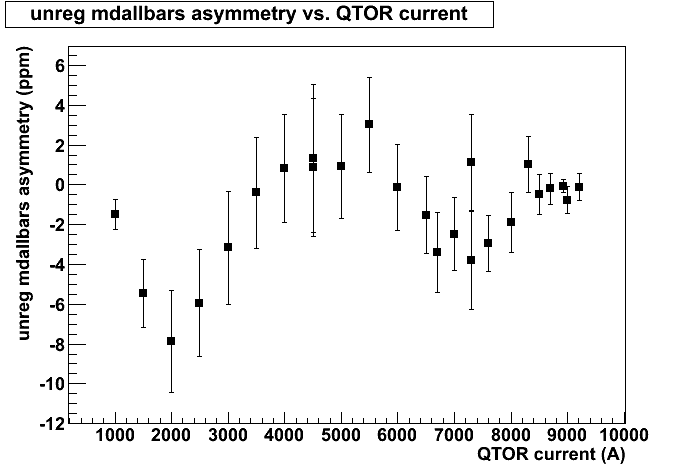
Asym -vs- QTOR
From Logbook entry https://qweak.jlab.org/elog/Analysis+%26+Simulation/254
Run 9908
1 hour run with HWP OUT
https://hallcweb.jlab.org/hclog/1102_archive/110211010249.html https://hallcweb.jlab.org/hclog/1102_archive/110211020513.html
Run 9905
1 hour run with HWP IN
https://hallcweb.jlab.org/hclog/1102_archive/110210233842.html https://hallcweb.jlab.org/hclog/1102_archive/110211002416.html
Combining 2 hour of data taking
QTOR= 6700 Amps
I_{beam} = 145 \mu A
= Asymmetry averaged over all Main Detectors
If I assume only having 50 \mu A then I would need to take 6 hours of data to get the same statistic as above.
If I take a week of data at 50 \muA then that would correspond to 28 runs like the above.
So the uncertainty would be reduced by The measurement would have an uncertainty of 0.579/sqrt{28} = 0.1 PPM
background
Dave Mack's technical note on Qweak Background contributions and propogating their error. File:Qweak Doc 965 v1.pdf
Regression
https://qweak.jlab.org/wiki/index.php/Q-weak_Regression_Wiki_Page
Data Analysis
getting Qweak data from the Silo
jcache -g hallc /mss/hallc/qweak/rootfiles/pass0/*run number here*
