HRRL 7-31-09
Default HRRL running Conditions
| Pulse Width | Rep Rate | Energy | |
| 8 mA | 100 ns | 1 Hz | 3 MeV |
cable names
| CH ID | Description |
| 2223A1 | Front Scintillator |
| 2223A2 | Rear Scintilaltor |
| 2223A3 | ADC Gate From counting house to Experimental Cell |
| 2223A4 | TDC start pulse from counting house to experimental cell (PMT front + beam Gate) |
| 2223A5 | Coincidenc between front + rear Scint + Gun pulser to scaler channel 8 |
| 2223A6 | Metalica sense wire 4 |
| 2223A7 | Delayed rear PMT pulse to ADC |
| 2223A8 | Plastica sense wire 4 |
| 2223A9 | Plastica to scaler channel 4 |
| 2223A10 | Front scintillator to ADC |
| 2223A11 | Metalica scaler channel 1 |
| 2223A12 | DAQ trigger |
DAQ Ntuple names
| Ntuple Variable | Description |
| ADC5 | Front Scintilator |
| ADC1 | Metalica sense wire 4 |
| ADC16 | Rear Scintilator |
| ADC13 | Plastica sense wire 4 |
| TDC1 | Metalica sense wire 4 |
| TDC3 | Plastika sense wire 4 |
ADC + Scaler + TDC + V1495
| Run Number | Distance to Metallica's Feedthrough tip (cm) | Metalica scaler counts scaler ch 4 | Plastika Scaler Counts scaler ch 1 | Rear PMT + Front PMT + Gun Pulse Counts Scaler Ch 8 | HV S:F:G | Discriminator (mV) | Metalica counts/PMT+Gun pulse |
| 1263 | 19 | 0 | 1400:-700:980 | 50 |
TDC Measurements
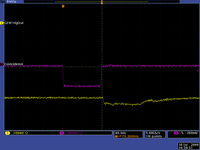
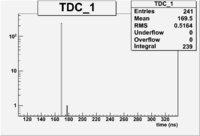
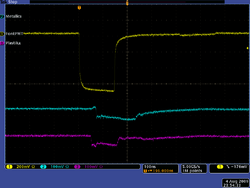
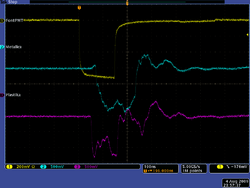
TDC Calibration
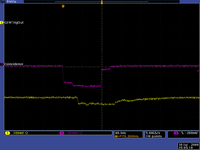
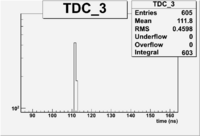
Second pulse width is 80 ns.
- Conclusion
In order to get actual time between the start and the stop pulse, one needs to subtract the width of the second signal. In this case it was 80 ns.
I need to do one more calibration run, which i think is gonna explain some things.
Actual Measurements
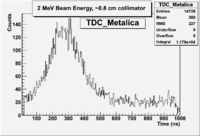
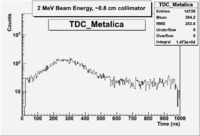
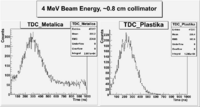
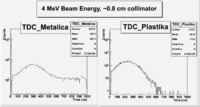
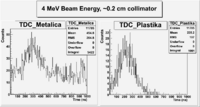
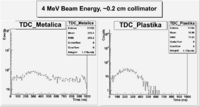
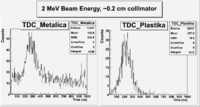
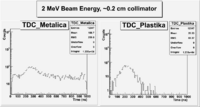
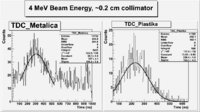
We had runs for different beam energy (2 && 4 MeV) and collimator size(~0.2 && ~0.8 cm).
Table below shows TDC measurements for all cases for Metalica and Plastika.
Plastika - 120 ns, Metalica - 170 ns.
- Example
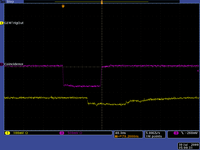
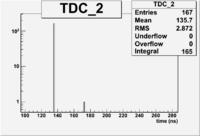
For Metalica on the TDC histogram mean value is 307, but the time between the pulse of the PMT+RFGate and Metalica is 307-170=137 ns. For Plastika it is 226.4-120=106.4ns. So time difference between this two pulses is around ~30 ns(the same on the scope).
VFAT runs
4 MeV beam energy, big collimator.
GEM HV settings: =3425/3125.
| Run Number | Card 1 Threshold | Card 2 Threshold |
| 1300 | 151 | 116 |
| 1301 | 153 | 118 |
| 1302 | 155 | 120 |
| 1303 | 157 | 122 |
GEM HV settings: =3425/3125.
4 MeV beam energy, small collimator.
| Run Number | Card 1 Threshold | Card 2 Threshold |
| 1305 | 151 | 124 |
File:Pb Attenuation Photon.pdf
