NAA SolarPanel
SolarPanel A Irradiation on Jack
Apparatus
Running conditions
Irradiated on Jack by placing samples just above the Radiator as shown in the picture.
Beam parameters: Irradiation Date : 5/23/18
Start Time: 09:07:30
Stop Time: 11:07:30
Rep Rate=300 Hz
I = 98 mA
Pulse Width = 10 usec
E = 38 MeV
The solar panel current output dropped 1 mA per hour during irradiation. The cove was too dark to produce a signal from ambient light. The observed signal was completely due to the electron beam.
Photonuclear cross section for Tungsten
The cross section for photon knockout of a neutron from several Tungsten Isotopes is given in the article below File:NucTech Volume 168 2009.pdf
and the figure below
Neutron Energy Spectrum
A simulation of 40 MeV electrons on thick Tungsten produces the Neutron energy spectrum below, overlay with the U-235 fission spectrum
File:NeutronEnergySpectFrom40MeVElectronsOnTungsten 061918.png
neutron Flux precitions
Radiation Damage Study of Materials The modified neutron source capable of producing 1014 n/cm2s, will generate ~2 DPA/year in steels (HT9, 304L, MA956). To achieve DPA levels of interest (>0.1 DPA at <400 °C) it would take about 20 days of neutron irradiation.
In File name:10uC_Cs_Mn_SolarPan_DetD_55.5cm_002.lst
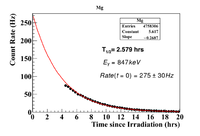
Measurements started at 14:45:38, 2:38:08 (158 min, 9488 sec) after irradiation ended,
Add 9488 seconds to time below to get time since irradiation
| Time (sec) | Sample |
| 0 | Cs-137 (661 keV line) #64121 55.5 cm away from face |
| 360 | Mn sample (1.7 g, 1.5 cm x 1.5 cm square, 847 keV) 55.5 cm away from face |
| 690 | Thorium Rods on face of detector |
| 1020 | Solar Panel A 55.5 cm away from face |
| 1410 | Cs-137 #129792 55.5 cm away from face |
| 1820 | Mn sample (847 keV) 55.5 cm away from face |
| 2230 | Cs-137 #129792 55.5 cm away from face (0.54% deadtime) |
| 2560 | Solar Panel A 55.5 cm away from face (0.55% deadtime, 300 Hz DAQ rate) |
| 2880 | Cs-137 (661 keV line) #64121 55.5 cm away from face (1.1% deadtime, 350 Hz) |
| 3070 | Mn sample (847 keV) 55.5 cm away from face (13 % deadtime, 4600 Hz) |
| 3330 | Ignore (Mn source was too close) Cs-137 #129792 15 cm away from face(6 % deadtime, 2000 Hz) |
| 3600 | Cs-137 #129792 15 cm away from face(.5 % deadtime, 200 Hz) |
| 4000 | Solar Panel A 15 cm away from face (2 % deadtime, 880 Hz DAQ rate) |
Check out Solar panel channels
root [24] MPA->Draw("evt.Chan>>(496,0,496)","evt.Sec> 2560 && evt.Sec<2800 && evt.Chan >306 && evt.Chan < 311");
root [25] MPA->Draw("evt.Chan>>(496,0,496)","evt.Sec> 1020 && evt.Sec<1260 && evt.Chan >306 && evt.Chan < 311");
Calibration
| Source | Energy (keV0 | Channel |
| Th Rod | 238.8 (highest peak) | 487.2 +/- 1.1 |
| Th Rod | 338.8 (4th highest) | 690.4 +/- 1.3 |
| Th Rod | 511 | |
| Th Rod | 583.4 (2nd highest peak) | 1189.6 + / 1.2 |
| Cs-137 | 661.7 | 1350 |
| Th Rod | 911.2 (3rd highest) | 1858.3 +/- 1.4 |
| Th Rod | 2614.6 | 5331.0 +/- 2.2 |
Energy (keV) = (0.065 +/- 1.34) + Channel*(0.490287 +/- 0.001174)
MPA->Draw("evt.Chan*(0.490) >>(6096,0,6096)","evt.Sec > 690 && evt.Sec < 1000");
Solar Panel Lines of interest
491, 528, 552.5, 847 , 1097 , 1293, 1303, 1810, 1997
In File name:10uC_Cs_Mn_SolarPan_DetD_55.5cm_003.lst
The measurement below started at 16:24:09, 4:16:39 after irradiation ended
Add 15399 seconds to time below to get time since irradiation
| Time (sec) | Sample |
| 0 | Thorium Rods on face of detector (2% deadtime, 750 Hz) |
| 350 | Mn sample (847 keV) 55.5 cm away from face (12% deadtime, 3800 Hz) |
Ended measurements at (9:34 am Thursday, 5/24/18)
Reference for Mn half life of 2.5785 hrs
https://journals.aps.org/prl/pdf/10.1103/PhysRevLett.60.2246
Rate Estimates
Activation Equations
R = Activations /cm^3/s
N = # atoms / cm^3
\sigma = Crossection (cm^2)
\phi = nuetron flux density ( neutrons/cm^2/s)
Observed Activity
Mass of Sample = 1.6992 g
Surface area 1 cm^2
30 cm from radiator
After irradiation the count rate from the Manganese witness foil was 250 Hz
Neutron capture cross section for manganese
https://journals.aps.org/prc/pdf/10.1103/PhysRevC.18.2079
Misnamed article below
| Min Energy (keV) | Max Energy (keV) | Cross Section (mb) |
| 3 | 6 | 81.3 |
| 6 | 9 | 186.6 |
| 9 | 12 | 67.1 |
| 12 | 15 | 27.7 |
| 15 | 20 | 43.6 |
| 20 | 30 | 44.6 |
| 30 | 40 | 44.7 |
| 40 | 50 | 28.2 |
| 50 | 60 | 26.0 |
| 60 | 80 | 21.5 |
| 80 | 100 | 16.3 |
| 100 | 120 | 14.3 |
| 120 | 140 | 15.2 |
| 140 | 160 | 8.3 |
| 160 | 180 | 8.6 |
| 180 | 200 | 8.3 |
| 200 | 220 | 6.5 |
| 220 | 240 | 6.3 |
| 240 | 260 | 5.6 |
| 260 | 280 | 5.6 |
| 280 | 300 | 6.6 |
| 300 | 320 | 5.8 |
| 320 | 340 | 5.7 |
| 340 | 360 | 5.8 |
| 360 | 380 | 4.3 |
| 380 | 400 | 5.1 |
| 400 | 420 | 5.9 |
| 420 | 440 | 5.0 |
| 440 | 460 | 5.6 |
| 460 | 480 | 5.6 |
| 480 | 500 | 4.6 |
| 500 | 550 | 4.2 |
| 550 | 600 | 4.8 |
| 600 | 650 | 3.8 |
| 650 | 700 | 4.3 |
