LB DetLimits Thesis
50% Excluded
For this analysis, begin by using the first measurement of the Se-75 line and using the standard exponential decay equation to correct it and its error back to the time of beam off. Below is a table of the Se-75 (120d) corrected measurements as well as the front nickel foils and the Mn-54 data for each measurement. Note the Mn-54 analysis was weighted by the mass of the soil.
| Sample | Activated (total beam time) | Counted | Fully Thesis Corrected Rate @ 1st Measurement (Hz) | |
| 10% Se/Soil Mixture | 5/23/17 and 5/24/17 (83 min) | 07/18/17 (16:25:44) | 3109.68 95.39 | 4280.08 131.29 |
| 10% Se/Soil Pure Witness selenium | 5/23/17 and 5/24/17 (83 min) | 8/1/17 (16:05:51) | 4161.29 127.63 | 6210.50 190.48 |
| 10% Se/Soil Front Inner Ni Foil | 5/23/17 (1h) | 5/23/17 (15:52:21) | 385955 23488.8 | 425064.36 25868.95 |
| 10% Se/Soil Mixture Mn-54 | 5/23/17 (1h) | 07/18/17 (16:25:44) | 15.63 0.56 | 17.67 0.63 |
| 1% Sample Se/Soil Mixture | 5/23/17 (1h) | 6/23/17 (16:39:03) | 2233.33 68.52 | 2675.24 82.08 |
| 1% Sample Se/Soil Pure Witness selenium | 5/23/17 (1h) | 7/20/17 (16:39:46) | 3840.86 117.81 | 5379.43 165.00 |
| 1% Sample Se/Soil Front Inner Ni Foil | 5/23/17 (1h) | 5/23/17 (17:59:39) | 261461 16045.7 | 293170.78 17991.71 |
| 1% Sample Se/Soil Mixture Mn-54 | 5/23/17 (1h) | 6/23/17 (16:39:03) | 9.38 0.39 | 10.05 0.42 |
| 0.1% Sample Se/Soil Mixture | 5/23/17 (30 min) | 6/19/17 (18:25:18) | 849.46 26.07 | 993.59 30.49 |
| 0.1% Sample Se/Soil Pure Witness Selenium | 5/23/17 (30 min) | 07/25/17 (16:32:52) | 834.41 25.61 | 1201.58 36.88 |
| 0.1% Sample Se/Soil Front Inner Ni Foil | 5/23/17 (30 min) | 5/24/17 (14:25:39 | 118412 7280.06 | 197670.18 12152.98 |
| 0.1% Sample Se/Soil Mn-54 | 5/23/17 (30 min) | 6/19/17 (18:25:18) | 9.38 0.33 | 9.96 0.35 |
Mn-54 Efficiency
A calibrated Mn-54 source was used to find the efficiency of an 834 keV line. The source was serial #J4-348, which had an activity of 9.882 on 8/01/12, so the activity on 4/18/17 was
Now converting to Hz gives
| Source | Energy (keV) | Position | Expected Rate (Hz) | ROOT Window (keV) | HpGe Rate (Hz) | HpGe Detector A Efficiency (%) |
| Mn-54 (J4-348) | 834 | 10cm (Det A) | 8138.05 3\% | [829,839] | 25.87 0.28 | 0.32 0.01 |
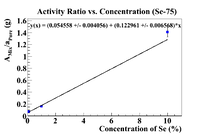
Below are plots of the activity ratio of the Se/Soil mixture and specific activity of the pure selenium pellet as a reference material. The plots also have no restrictions on the equation of the line.
Following the analysis in Nate's thesis, the initial concentration should be the intercept on the x-axis, which is
By decreasing the quotient by two standard deviations, we get
This is much more physical than previous answers, but it is still not on the micro gram per gram level. Let's try some other reference materials
