LB Thesis SNR
Background Analysis
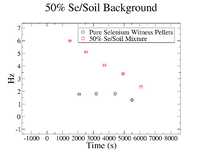
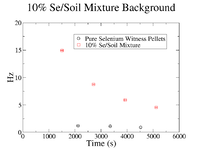
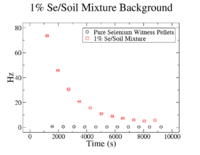
In order to find the SNR at , the background was analyzed to check if it remained constant from until . First, the background was plotted for each concentration of Se/Soil and was overlaid with the the background in the pure sample for each respective target.
The clearest exponential behavior is seen in the 1% sample. The background rate dropped by 62% between the first and second measurements ( = 7.5 minutes). This indicated that considering the background to be constant from until , which was an average of


