170049 1% Se Soil Mixture Analysis

From New IAC Wiki
Revision as of 01:19, 29 March 2018 by Brenleyt (talk | contribs) (→‎Nickel Foil Information)
(diff) ← Older revision | Latest revision (diff) | Newer revision → (diff)
Jump to navigation Jump to search

Below is the information for the target

Front Outer Nickel Foil: 3.4274g

Outer Se: 0.0914g

Soil: 10.240g

Inner Front Foil: 1.8672g

Inner Rear Foil: 1.7220g

Inner Se: 0.0954g

Rear Outer Foil: 3.4887g

Below is a table with the data that is to be analyzed for the mixture:

0<t<300 750<t<1050 1508<t<1808 2260<t<2560 3030<t<3330 3820<t<4120 4580<t<4880 5325<t<5625 6085<t<6385 6835<t<7135 7585<t<7930
Thin Window Histogram LB 170049 0 t 300Sec MixSpectrum ThinWindow.png LB 170049 750 t 1050Sec MixSpectrum ThinWindow.png LB 170049 1508 t 1808Sec MixSpectrum ThinWindow.png LB 170049 2260 t 2560Sec MixSpectrum ThinWindow.png LB 170049 3030 t 3330Sec MixSpectrum ThinWindow.png LB 170049 3820 t 4120Sec MixSpectrum ThinWindow.png LB 170049 4580 t 4880Sec MixSpectrum ThinWindow.png LB 170049 5325 t 5625Sec MixSpectrum ThinWindow.png LB 170049 6085 t 6385Sec MixSpectrum ThinWindow.png LB 170049 6835 t 7135Sec MixSpectrum ThinWindow.png LB 170049 7585 t 7930Sec MixSpectrum ThinWindow.png
Expanded Window Histogram LB 170049 0 t 300Sec MixSpectrum ExpWindow.png LB 170049 750 t 1050Sec MixSpectrum ExpWindow.png LB 170049 1508 t 1808Sec MixSpectrum ExpWindow.png LB 170049 2260 t 2560Sec MixSpectrum ExpWindow.png LB 170049 3030 t 3330Sec MixSpectrum ExpWindow.png LB 170049 3820 t 4120Sec MixSpectrum ExpWindow.png LB 170049 4580 t 4880Sec MixSpectrum ExpWindow.png LB 170049 5325 t 5625Sec MixSpectrum ExpWindow.png LB 170049 6085 t 6385Sec MixSpectrum ExpWindow.png LB 170049 6835 t 7135Sec MixSpectrum ExpWindow.png LB 170049 7585 t 7930Sec MixSpectrum ExpWindow.png
Signal in Thin Window [math] 6.662 \times 10^4 [/math] [math] 5.074 \times 10^4 [/math] [math] 3.909 \times 10^4[/math] [math]3.220 \times 10^4 [/math] [math] 2.718 \times 10^4[/math] [math]2.18 \times 10^4 [/math] [math] 1.855 \times 10^4[/math] [math]1.578 \times 10^4 [/math] [math] 1.228 \times 10^4[/math] [math] 1.16 \times 10^4[/math] [math] 1.241 \times 10^4[/math]
Signal in Expanded Window [math] 1.132 \times 10^5 [/math] [math] 8.025 \times 10^4[/math] [math]5.866 \times 10^4 [/math] [math] 4.532 \times 10^4[/math] [math]3.735 \times 10^4[/math] [math] 2.868 \times 10^4[/math] [math]2.424 \times 10^4[/math] [math] 2.102 \times 10^4[/math] [math] 1.592 \times 10^4[/math] [math] 1.488 \times 10^4[/math] [math]1.662 \times 10^4 [/math]
[math] S_{Expanded} - S_{Thin} [/math] [math] 4.6580 \times 10^4 [/math] [math] 2.9510 \times 10^4 [/math] [math] || \lt math\gt 1.9570 \times 10^4 [/math] [math] 1.3120 \times 10^4 [/math] [math] 1.0170 \times 10^4 [/math] [math] 6.880 \times 10^3 [/math] [math] 5.690 \times 10^3 [/math] [math] 5.240 \times 10^3 [/math] [math] 3.640 \times 10^3 [/math] [math]3.280 \times 10^3 [/math] [math] 4.210 \times 10^3 [/math]
Integrated Background [math] 4.47 \times 10^4 \pm 1.221 \times 10^2 [/math] [math] 2.7680 \times 10^4 \pm 9.632 \times 10^2 [/math] [math] 1.8620 \times 10^4 \pm 7.94 \times 10^2 [/math] [math] 1.2656 \times 10^4 \pm 6.62 \times 10^2[/math] [math] 9.542 \times 10^3 \pm 5.84 \times 10^2 [/math] [math] 6.508 \times 10^3 \pm 5.04 \times 10^2 [/math] [math]5.470 \times 10^3 \pm 4.54 \times 10^2 [/math] [math] 4.512 \times 10^3 \pm 4.34 \times 10^2 [/math] [math] 3.308 \times 10^3 \pm 0.368 \times 10^3 [/math] [math] 3.148 \times 10^3 \pm 0.348 \times 10^3 [/math] [math] 3.896 \times 10^3 \pm 0.388 \times 10^3 [/math]
Signal - Background [math] 2.1920 \times 10^4 \pm 4.6580 \times 10^4[/math] [math] 2.3060 \times 10^4 \pm 2.9510 \times 10^4 [/math] [math] 2.0470 \times 10^4 \pm 1.9570 \times 10^4 [/math] [math] 1.9544 \times 10^4 \pm 1.3120 \times 10^4 [/math] [math]1.7638 \times 10^4 \pm 1.0170 \times 10^4 [/math] [math] 1.5292 \times 10^4 \pm 0.6880 \times 10^4 [/math] [math] 1.3080 \times 10^4 \pm 0.5690 \times 10^4 [/math] [math] 1.0540 \times 10^4 \pm 0.5240 \times 10^3 [/math] [math] 8.972 \times 10^3 \pm 3.640 \times 10^3 [/math] [math]8.452 \times 10^3 \pm 3.280 \times 10^3 [/math] [math]8.514 \times 10^3 \pm 4.210 \times 10^3 [/math]
Runtime (s) 300 300 300 300 300 300 300 300 300 300 300
Rate (Hz) 73.03 +/- 155.27 76.87 +/- 98.37 68.23 +/- 65.23 65.15 +/- 43.73 58.79 +/- 33.9 50.97 +/- 22.9 43.6 +/- 18.97 35.13 +/- 17.47 29.91 +/- 12.13 28.17 +/- 10.93 21.28 +/- 10.53
Integral Decay Correction (Hz) 75.30 +/- 160.02 79.22 +/- 101.37 70.31 +/- 67.22 67.14 +/- 45.07 60.59 +/- 34.93 52.53 +/- 23.60 44.93 +/- 19.55 36.20 +/- 18.00 30.82 +/- 12.50 29.03 +/- 11.26 21.93 +/- 10.85
Dead Time (%) 6.59 +/- 0.43 5.95 +/- 0.42 2.53 +/- 0.31 1.92 +/- 0.26 1.33 +/- 0.23 0.84 +/- 0.16 0.65 +/- 0.15 0.65 +/- 0.15 0.51 +/- 18 0.51 +/- 0.18 0.51 +/- 0.18
Dead Time Corrected Signal (Hz) 80.61 +/- 171.31 84.23 +/- 107.78 72.14 +/ 68.97 68.45 +/- 45.95 61.41 +/- 35.40 52.97 +/- 23.80 45.22 +/- 19.68 36.44 +/- 18.12 30.98 +/- 12.56 29.18 +/- 11.32 22.04 +/- 10.91
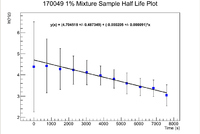
.Dat File Entry For HL Plot 4.39 +/- 2.13 4.43 +/- 1.28 4.28 +/- 0.96 4.23 +/- 0.67 4.12 +/- 0.58 3.97 +/- 0.45 3.81 +/- 0.44 3.60 +/- 0.50 3.43 +/- 0.41 3.37 +/- 0.39 3.09 +/- 0.50

Below is the table for the pure selenium sample which was outside the aluminum cylinder


367<t<667 1126<t<1426 1886<t<2186 2640<t<2940 3440<t<3740 4200<t<4500 4950<t<5250 5710<t<6010 6460<t<6760 7210<t<7510 8010<t<8310
Thin Window Histogram LB 170049 367 t 667Sec PureSeSpectrum ThinWindow.png LB 170049 1126 t 1426Sec PureSeSpectrum ThinWindow.png LB 170049 1886 t 2186Sec PureSeSpectrum ThinWindow.png LB 170049 2640 t 2940Sec PureSeSpectrum ThinWindow.png LB 170049 3440 t 3740Sec PureSeSpectrum ThinWindow.png LB 170049 4200 t 4500Sec PureSeSpectrum ThinWindow.png LB 170049 4950 t 5250Sec PureSeSpectrum ThinWindow.png LB 170049 5710 t 6010Sec PureSeSpectrum ThinWindow.png LB 170049 6460 t 6760Sec PureSeSpectrum ThinWindow.png LB 170049 7210 t 7510Sec PureSeSpectrum ThinWindow.png LB 170049 8010 t 8310Sec PureSeSpectrum ThinWindow.png
Expanded Window Histogram LB 170049 367 t 667Sec PureSeSpectrum ExpWindow.png LB 170049 1126 t 1426Sec PureSeSpectrum ExpWindow.png LB 170049 1886 t 2186Sec PureSeSpectrum ExpWindow.png LB 170049 2640 t 2940Sec PureSeSpectrum ExpWindow.png LB 170049 3440 t 3740Sec PureSeSpectrum ExpWindow.png LB 170049 4200 t 4500Sec PureSeSpectrum ExpWindow.png LB 170049 4950 t 5250Sec PureSeSpectrum ExpWindow.png LB 170049 5710 t 6010Sec PureSeSpectrum ExpWindow.png LB 170049 6460 t 6760Sec PureSeSpectrum ExpWindow.png LB 170049 7210 t 7510Sec PureSeSpectrum ExpWindow.png LB 170049 8010 t 8310Sec PureSeSpectrum ExpWindow.png
Signal in Thin Window [math] 6.152 \times 10^4[/math] [math] 5.41 \times 10^4[/math] [math]4.815 \times 10^4 [/math] [math]3.991 \times 10^4 [/math] [math]3.545 \times 10^4 [/math] [math]2.963 \times 10^4 [/math] [math]2.737 \times 10^4 [/math] [math]2.295 \times 10^4 [/math] [math] 1.918 \times 10^4[/math] [math] 1.673 \times 10^4[/math] [math]1.497 \times 10^4 [/math]
Signal in Expanded Window [math]6.945 \times 10^4 [/math] [math] 6.001 \times 10^4[/math] [math] 5.32 \times 10^4[/math] [math] 4.411 \times 10^4[/math] [math]3.914 \times 10^4 [/math] [math] 3.28 \times 10^4[/math] [math]3.004 \times 10^4 [/math] [math] 2.558 \times 10^4[/math] [math] 2.206 \times 10^4[/math] [math] 1.933 \times 10^4[/math] [math]1.71 \times 10^4 [/math]
[math] S_{Expanded} - S_{Thin} [/math] 7930 5910 5050 4200 3690 3170 2670 2630 2880 2600 2130
Integrated Background 4710 +/- 44.6 3854 +/- 40.2 2976 +/- 35.8 2656 +/- 33.4 2485 +/- 32.2 2302 +/- 31 2032 +/- 29.4 1943.2 +/- 28.6 2108 +/- 29.8 1769.4 +/- 27.8 1731.8 +/- 27.4
Signal - Background [math] 5.6810 \times 10^4 \pm 0.7930 \times 10^4 [/math] [math] 5.0246 \times 10^4 \pm 0.5910 \times 10^4 [/math] [math] 4.5174 \times 10^4 \pm 0.5050 \times 10^4 [/math] [math] 3.7254 \times 10^4 \pm 0.4200 \times 10^4 [/math] [math] 3.2992 \times 10^4 \pm 0.3690 \times 10^4 [/math] [math] 2.7328 \times 10^4 \pm 0.3170 \times 10^4 [/math] [math] 2.4700 \times 10^4 \pm 0.2670 \times 10^4 [/math] [math] 2.10068 \times 10^4 \pm 0.2630 \times 10^4 [/math] [math] 1.7072 \times 10^4 \pm 0.2880 \times 10^4 [/math] [math] 1.49606 \times 10^4 \pm 0.2600 \times 10^4 [/math] [math] 1.32382 \times 10^4 \pm 0.2130 \times 10^4 [/math]
Runtime (s) 300 300 300 300 300 300 300 300 300 300 300
Rate (Hz) 189.37 +/- 26.43 167.48 +/- 19.7 150.58 +/- 16.83 124.18 +/- 14 109.97 +/- 12.3 91.09 +/- 10.57 82.33 +/- 8.9 70.02 +/- 8.77 56.91 +/- 9.6 49.87 +/- 8.67 44.13 +/- 7.1
Integral Decay Correction (Hz) 195.16 +/- 27.24 172.61 +/- 20.30 155.18 +/- 17.34 127.97 +/- 14.43 113.33 +/- 12.67 93.87 +/- 10.84 84.85 +/- 9.17 72.16 +/- 9.04 58.65 +/- 9.89 51.39 +/- 8.93 45.48 +/- 7.32
Dead Time (%) 0.41 +/- 0.11 0.41 +/- 0.11 0.29 +/- 0.11 0.24 +/- 0.10 0.24 +/- 0.11 0.24 +/- 0.11 0.24 +/- 0.11 0.24 +/- 0.11 0.24 +/- 0.11 0.24 +/- 0.11 0.24 +/- 0.11
Dead Time Corrected Signal (Hz) 195.96 +/- 27.35 133.32 +/- 20.38 155.63 +/- 17.39 128.28 +/- 14.46 113.60 +/- 12.70 94.09 +/- 10.87 85.08 +/- 9.19 72.33 +/- 9.06 58.79 +/- 9.91 51.51 +/- 8.95 45.59 +/- 7.34
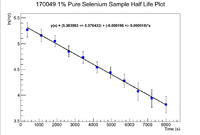
.Dat File Entry For HL Plot 5.27 +/- 0.14 5.16 +/- 0.12 5.05 +/- 0.11 4.85 +/- 0.11 4.73 +/- 0.11 4.54 +/- 0.11 4.44 +/- 0.11 4.28 +/- 0.13 4.07 +/- 0.17 3.94 +/- 0.17 3.82 +/- 0.16

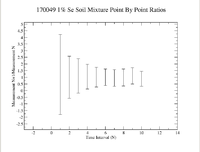
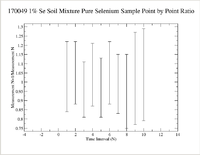
Below are the Half life plots and hte point by point ratio plots for the mixture and the pure selenium sample. Note the error in the mixture.

170049 MixSample HLPlot.png LB 170049 PureSe HLPlot.png 170049 SeSoilMix PBPRatios.png 170049 PureSe PBPRatio.png


Nickel Foil Information

For the nickel I have been using counting statistics ([math] \sqrt N[/math]) to find the error in the signal. This is due to the fact that I can pin down the half life within uncertainty using this type of error.

Below is a table for the front outer nickel foil that was used in the sample.


5/23/17 5/26/17 5/27/17 5/29/17 5/30/17
Thin Window Histogram 170049 FrontOuterFoil ThinWindow 5 23 17.png 170049 FrontOuterFoil ThinWindow 5 25 17.png 170049 FrontOuterFoil ThinWindow 5 27 17.png 170049 FrontOuterFoil ThinWindow 5 29 17.png 170049 FrontOuterFoil ThinWindow 5 30 17.png
Original Histogram 170049 FrontOuterFoil OGWindow 5 23 17.png 170049 FrontOuterFoil OGWindow 5 25 17.png 170049 FrontOuterFoil OGWindow 5 27 17.png 170049 FrontOuterFoil OGWindow 5 29 17.png 170049 FrontOuterFoil OGWindow 5 30 17.png
Signal 5593 +/- 77.03 8045 +/- 89.69 9845 +/- 99.22 11620 +/- 107.80 7532 +/- 86.79
Integrated Background 365.28 +/- 28.16 291.36 +/- 24.96 428.48 +/- 30.4 688 +/- 38.4 365.38 +/- 28.16
Signal - Background 5227.72 +/-82.02 7753.64 +/- 93.10 9416.52 +/- 103.77 10932 +/- 114.44 7166.72 +/- 91.24
Runtime (s) 300.587 300.511 300.622 302.195 301.247
Rate (Hz) 17.39 +/- 0.27 25.80 +/- 0.31 31.32 +/- 0.35 36.18 +/- 0.38 23.79 +/- 0.30
Integral Decay Correction (Hz) 17.40 +/- 0.27 25.82 +/- 0.31 31.35 +/- 0.35 36.21 +/- 0.38 23.81 +/- 0.30
Dead Time (%) 2.53 +/- 0.31 3.95 +/- 0.42 5.06 +/- 0.39 5.87 +/- 0.54 5.06 +/- 0.39
Dead Time Corrected Signal (Hz) 17.85 +/- 0.28 26.88 +/-0.34 33.02 +/- 0.39 38.47 +/- 0.46 25.08 +/- 0.33
Position on Det A (cm) 70 30 20 10 10
Efficiency (%) 0.0089 +/- 0.000179 0.0422 +/- 0.000467 0.0847 +/- 0.000706 0.31 +/- .003 0.31 +/- 0.003
Efficiency Corrected Rate 200561.80 +/- 5115.57 63696.68 +/- 1070.51 38984.65 +/- 563.56 12409.68 +/- 190.90 8090.32 +/- 132.14
.Dat File Entry For HL Plot 12.21 +/- 0.03 11.06 +/- 0.02 10.57 +/- 0.01 9.43 +/- 0.02 9.00 +/- 0.02


Below is the table for the rear outer foil:

5/23/17 5/29/17 5/30/17
Thin Window Histogram 170049 RearOuterFoil ThinWindow 5 23 17.png 170049 RearOuterFoil ThinWindow 5 29 17.png 170049 RearOuterFoil ThinWindow 5 30 17.png
Expanded Window Histogram 170049 RearOuterFoil OGWindow 5 23 17.png 170049 RearOuterFoil OGWindow 5 29 17.png 170049 RearOuterFoil OGWindow 5 30 17.png
Signal in Window 4337 +/- 65.86 8243 +/- 90.79 5573 +/- 74.65
Integrated Background 122.90 +/- 16 388.96 +/- 28.96 250.88 +/- 23.36
Signal - Background 4214.1 +/- 67.78 7854.04 +/- 95.30 5322.12 +/- 78.22
Runtime (s) 301.51 300.197 300.631
Rate (Hz) 13.98 +/- 0.22 26.16 +/- 0.32 17.70 +/- 0.26
Integral Decay Correction (Hz) 13.99 +/- 0.22 26.18 +/- 0.32 17.71 +/- 0.26
Dead Time (%) 1.92 +/- 0.26 3.95 +/- 0.42 3.06 +/- 0.30
Dead Time Corrected Signal (Hz) 14.26 +/- 0.23 27.26 +/- 0.35 18.27 +/- 0.27
Position on Det A (cm) 70 10 10
Efficiency (%) 0.0089 +/- 0.000179 0.31 +/- 0.003 0.31 +/- 0.003
Efficiency Corrected Rate (Hz) 160224.72 +/- 4130 8793.55 +/- 141.38 5893.55 +/- 104.11
.Dat File Entry For HL Plot 11.98 +/- 0.03 9.08 +/- 0.02 8.68 +/- 0.02

Flux Simulations

The purpose of the flux simulations is to find if the factor that makes my ratios different than Segebade's. Below is the flux through the nickel foil.