Recreation of Plots Using GEMC 2.5
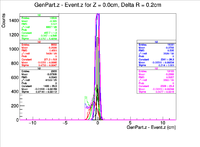
Here are the plots that I am trying to recreate
https://clasweb.jlab.org/wiki/index.php/File:EG12_SweetSpotVertex_ZdiffDist_10-6-16.png
using the commands
clas12->Draw("GenPart.z-Event.z >> R1(1000,-5,5)","abs(GenPart.x-Event.x)<1 && abs(GenPart.y-Event.y)<1 && sqrt(GenPart.x*GenPart.x+GenPart.y*GenPart.y)<0.2");
clas12->Draw("GenPart.z-Event.z >> R7(1000,-5,5)","abs(GenPart.x-Event.x)<1 && abs(GenPart.y-Event.y)<1 && sqrt(GenPart.x*GenPart.x+GenPart.y*GenPart.y)>0.6 && sqrt(GenPart.x*GenPart.x+GenPart.y*GenPart.y)<0.8");
Here is the gcard used
<gcard>
      <detector name="../../../../../../clas12/fc/forwardCarriage" factory="TEXT" variation="original"/>
      <detector name="../../../../../../clas12/dc/dc"            factory="TEXT" variation="ccdb"/>
      <detector name="../../../../../../clas12/ec/ec"            factory="TEXT" variation="original"/>
      <detector name="../../../../../../clas12/ctof/ctof"            factory="TEXT" variation="original"/>
      <detector name="../../../../../../clas12/ftof/ftof"            factory="TEXT" variation="java"/>
      <detector name="../../../../../../clas12/htcc/htcc"            factory="TEXT" variation="original"/>
      <detector name="../../../../../../clas12/magnets/solenoid" factory="TEXT" variation="original"/>
      <detector name="../../../../../../clas12/pcal/pcal"            factory="TEXT" variation="javageom"/>
      <option name="SCALE_FIELD" value="clas12-torus-big, -1"/>
      <option name="HALL_FIELD"  value="clas12-solenoid"/>
      <option name="OUTPUT" value="evio,eg12_sol_75k_1cm_DiskTarg_30DegRot_GEMC_2.5.ev"/>
       <option name="BEAM_P" value="e-, 6.0*GeV, 25.0*deg, 30*deg"/>
               <option name="SPREAD_V" value="(1.0,0.0)cm"/>
</gcard>
Here is the command line for GEMC:
~/src/CLAS/GEMC/2.0.Linux__Ubuntu16.04-x86_64-gcc5.4.0/gemc/2.5/gemc -USE_GUI=0 -N=75000 eg12.gcard
I used the same coatjava command (no fields) as seen below
~/src/CLAS/coatjava-2.4/bin/clas12-reconstruction -config GEOM::new=true -s DCHB:DCTB:EC:FTOF:EB -config DATA::mc=true -config DCTB::useRaster=true -i eg12_sol_75k_1cm_DiskTarg_30DegRot_GEMC_2.5.ev -o eg12_sol_75k_1cm_DiskTarg_30DegRot_GEMC_2.5_rec.evio
and finally the evio2root command line (done on lds2):
~/src/CLAS/evioRoot/bin/evio2root eg12_sol_75k_1cm_DiskTarg_30DegRot_GEMC_2.5_rec.evio eg12_sol_75k_1cm_DiskTarg_30DegRot_GEMC_2.5_rec.root 75000
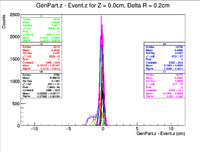
For the plot below I required that Event.z is non-zero and that Event.z < 2cm.
Since these 2 plots were statistically different, I will try to use the same random number generator. Here is the gcard I used: <gcard>
      <detector name="../../../../../../clas12/fc/forwardCarriage" factory="TEXT" variation="original"/>
      <detector name="../../../../../../clas12/dc/dc"            factory="TEXT" variation="ccdb"/>
      <detector name="../../../../../../clas12/ec/ec"            factory="TEXT" variation="original"/>
      <detector name="../../../../../../clas12/ctof/ctof"            factory="TEXT" variation="original"/>
      <detector name="../../../../../../clas12/ftof/ftof"            factory="TEXT" variation="java"/>
      <detector name="../../../../../../clas12/htcc/htcc"            factory="TEXT" variation="original"/>
      <detector name="../../../../../../clas12/magnets/solenoid" factory="TEXT" variation="original"/>
      <detector name="../../../../../../clas12/pcal/pcal"            factory="TEXT" variation="javageom"/>
      <option name="SCALE_FIELD" value="clas12-torus-big, -1"/>
      <option name="HALL_FIELD"  value="clas12-solenoid"/>
      <option name="OUTPUT" value="evio,eg12_sol_75k_1cm_DiskTarg_30DegRot_GEMC_2.5_new.ev"/>
       <option name="BEAM_P" value="e-, 6.0*GeV, 25.0*deg, 0*deg"/>
       <option name="SPREAD_V" value="(1.0,0.0)cm"/>
<option name="RANDOM" value="123483273456"/>
</gcard>
Here is the GEMC command line:
~/src/CLAS/GEMC/2.0.Linux__Ubuntu16.04-x86_64-gcc5.4.0/gemc/2.5/gemc -USE_GUI=0 -N=75000 eg12_sol_1cm_DiskTarg.gcard
and the reconstruction line:
~/src/CLAS/coatjava-2.4/bin/clas12-reconstruction -config GEOM::new=true -s DCHB:DCTB:EC:FTOF:EB -config DATA::mc=true -config DCTB::useRaster=true -i eg12_sol_75k_1cm_DiskTarg_30DegRot_GEMC_2.5_new.ev -o eg12_sol_75k_1cm_DiskTarg_30DegRot_GEMC_2.5_rec_new.evio
Here are the histograms to be compared to mine created on 10/26/16
https://clasweb.jlab.org/wiki/index.php/File:EG12_SweetSpotVertex_ZdiffDist_10-26-16.png
and here are the plots using the sample cuts above provided by Dr. Forest:
I haven't perfected setting stat box titles in my macro yet, but the order is that black is 0.0cm-0.2cm, then the stat boxes rotate around clockwise where magenta is 0.8cm-1.0cm.

