Vandagraph room
Go back JB Analysis
run 5005, March 28 2016
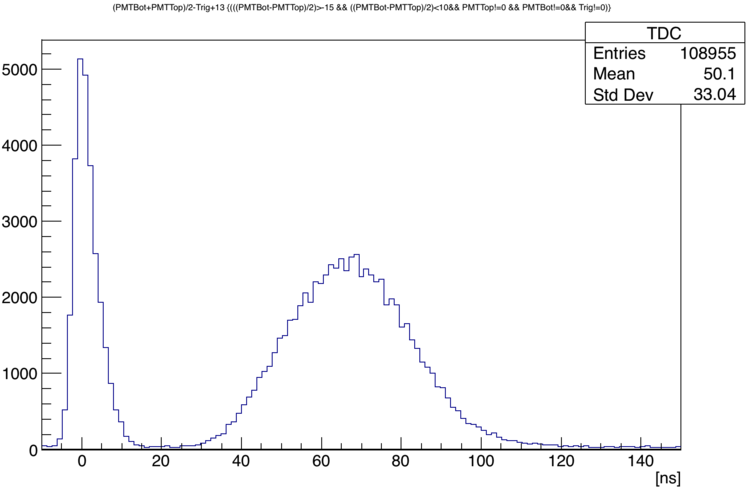
Here is the ToF spectrum while the source and trigger were placed 1.62 meters from the center of the detector. Data was gathered for a duration of 16 hours and 16 mins.
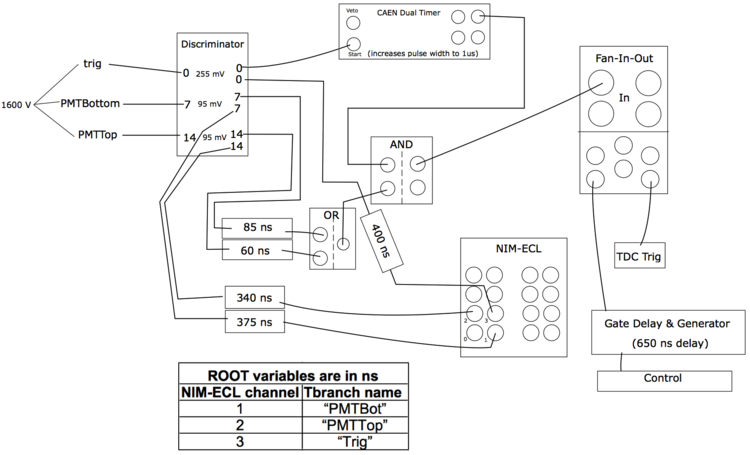
This is how the hardware was configured for this run:

Google drive link to the root file on the DAQ (r5005.root, ~60 MB):
https://drive.google.com/open?id=0B0i9-U4ubKLXTWtLOHB6VThSTmM
Google drive link to the .root file I use for analysis. This tree contains only the channels in use during the measurement, and the branches are named according to the table in the figure above. (1.2 MB):
https://drive.google.com/open?id=0B0i9-U4ubKLXWXlQLXpZQ2pLczA
run 5101, March 28 2016
Distance from source to detector was 1.79 meters, PMT thresholds are at 50 mV.
ROOT file: https://drive.google.com/file/d/0B0i9-U4ubKLXYWhNMkJ2bGNiZVU/view?usp=sharing
