JB Analysis
Jump to navigation
Jump to search
Go back 2nCor_44
Vandagraph room experiments
Elastic scattering in target
DU runs
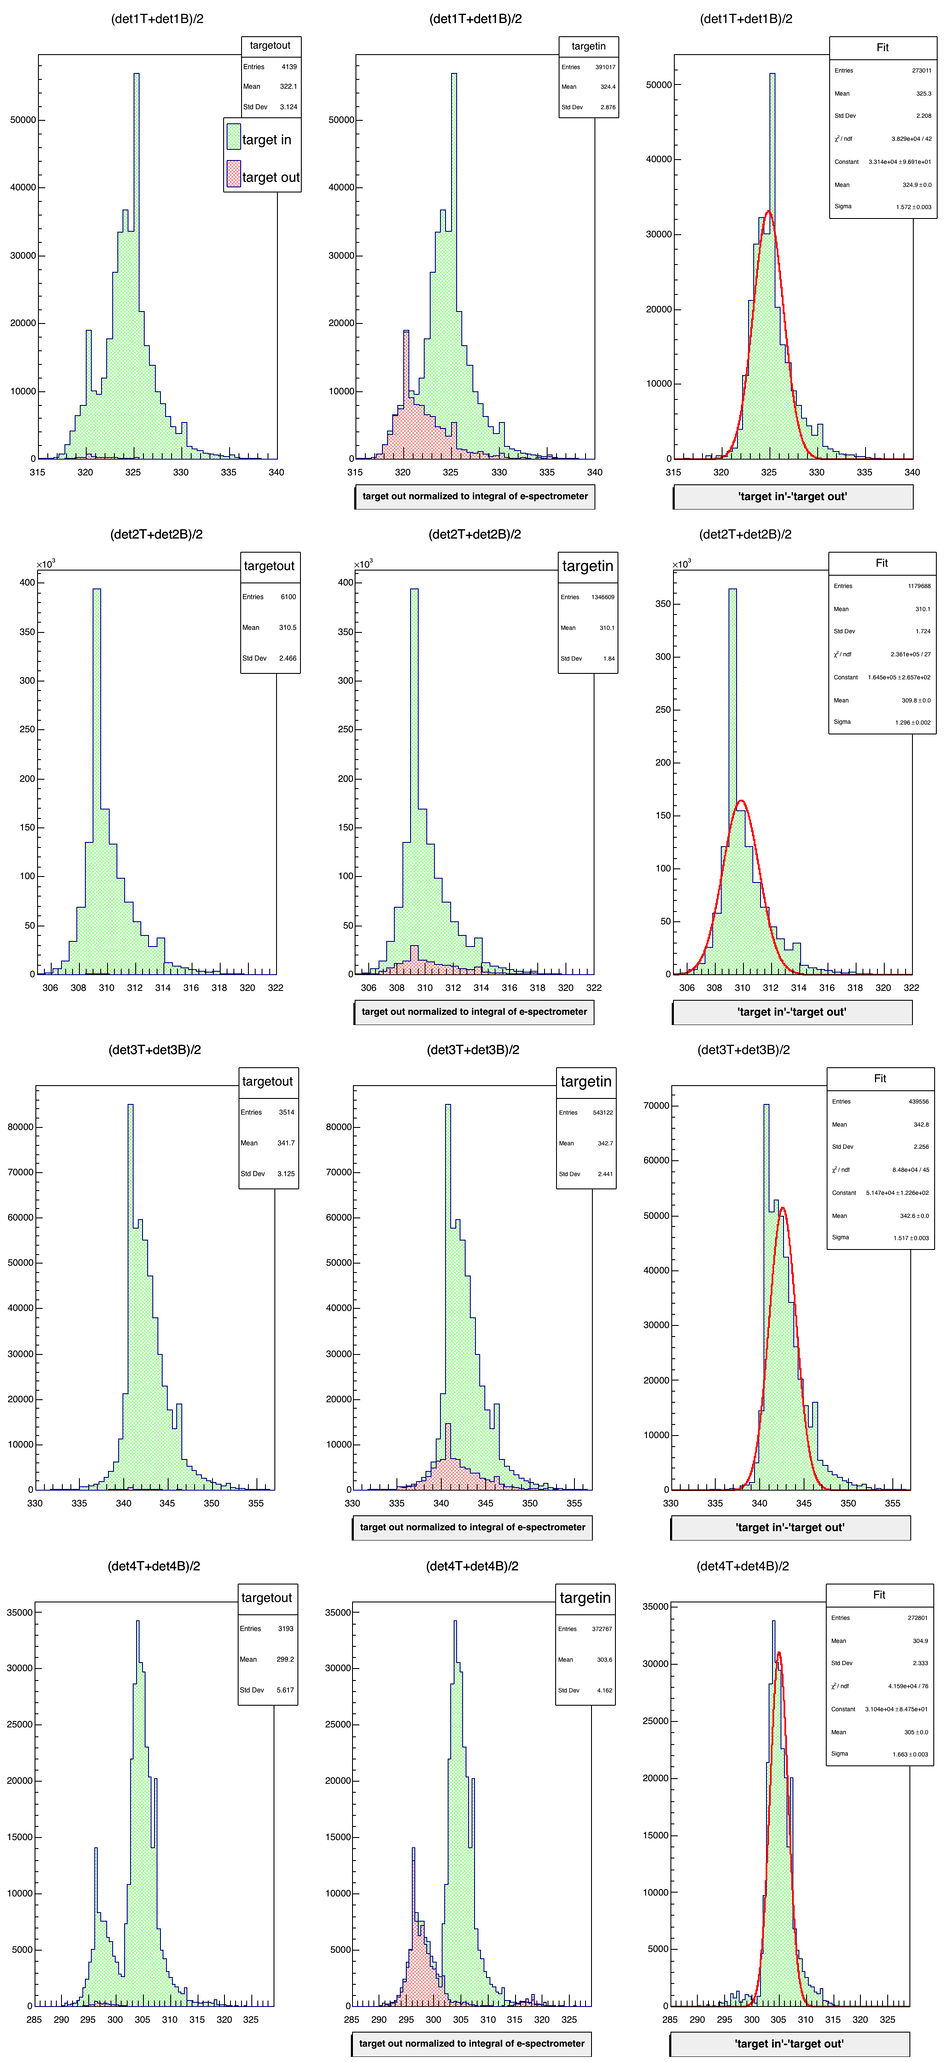
TDC spectrum
Target in vs. target out
Gamma peak is revealed by comparing target in and target out runs.
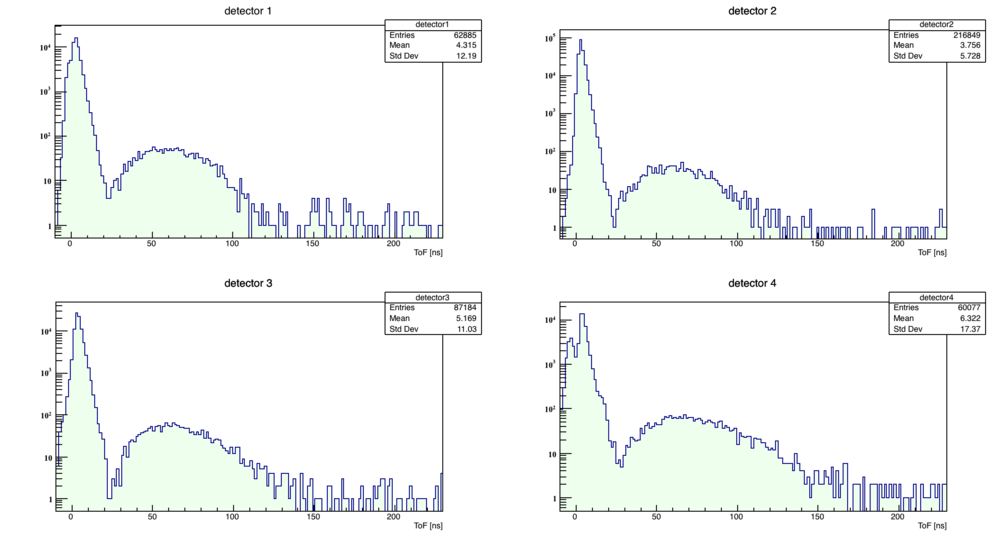
ToF
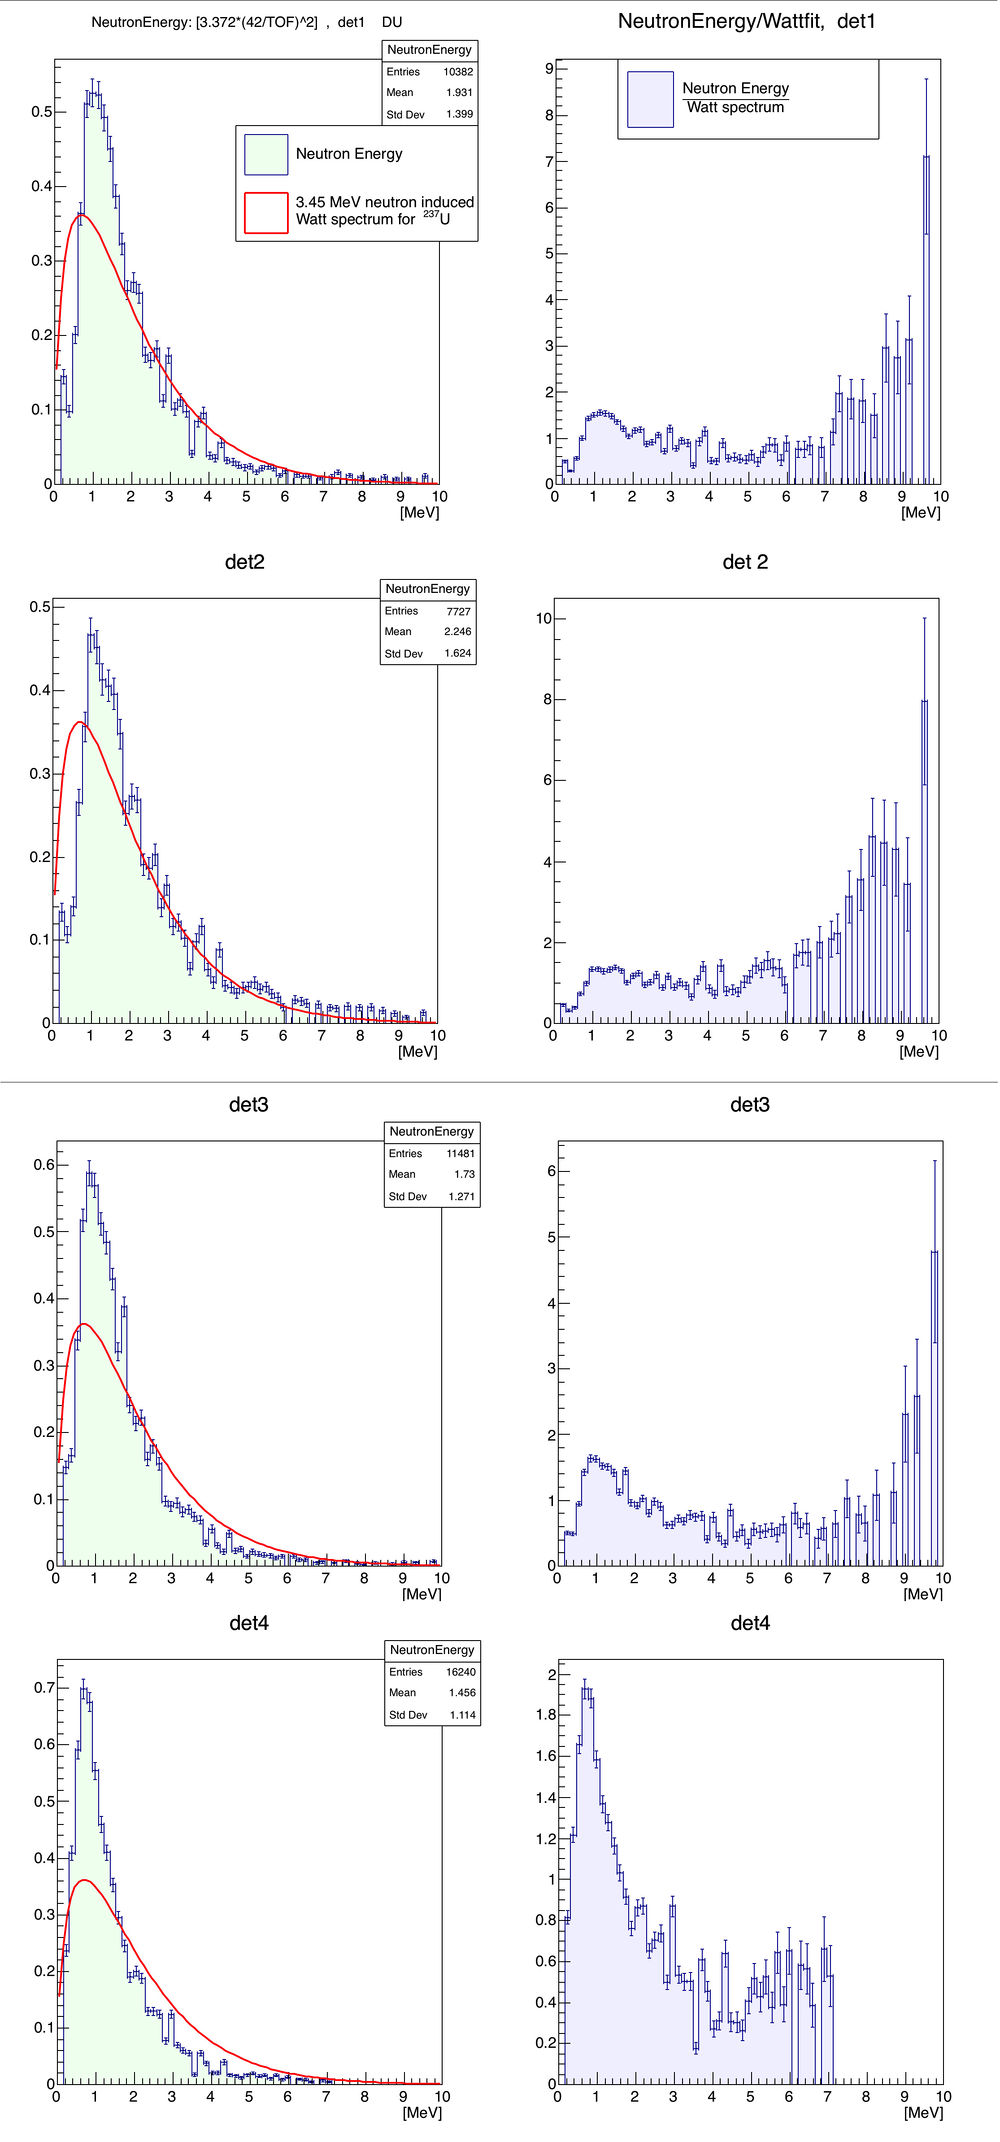
Energy
Neutron Energy:
Watt distribution:
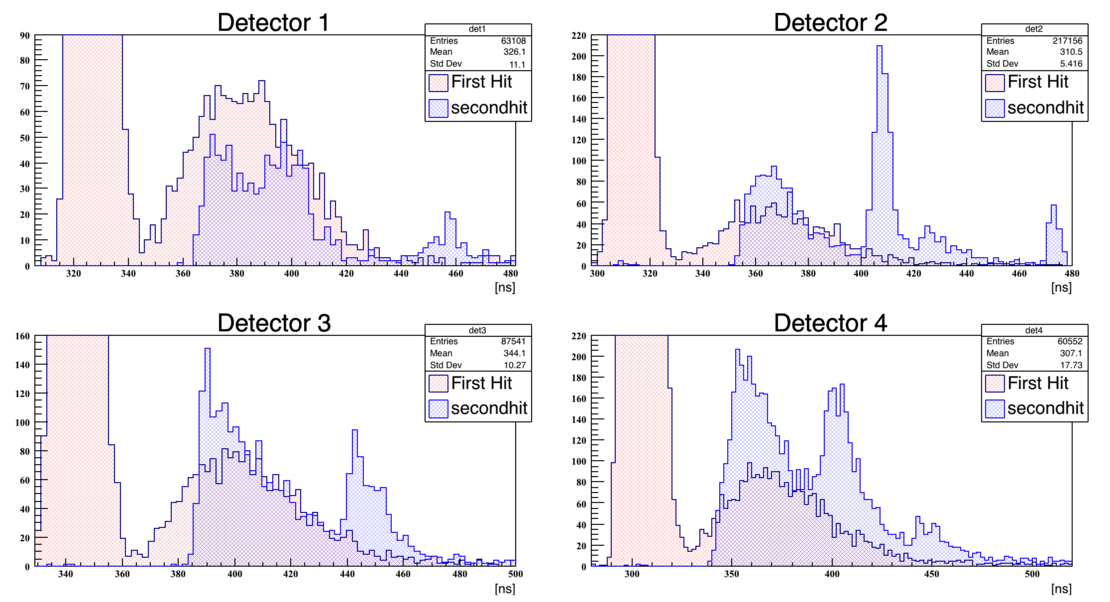
Second Hit
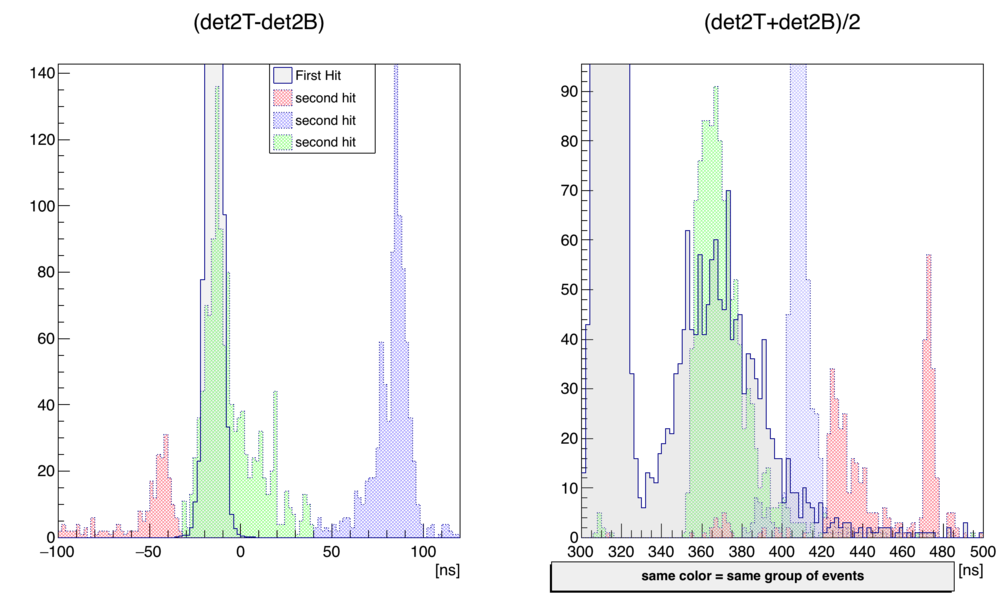
Odd TDC spectrum in the second hit:
Applying cuts based on TDC difference could help:
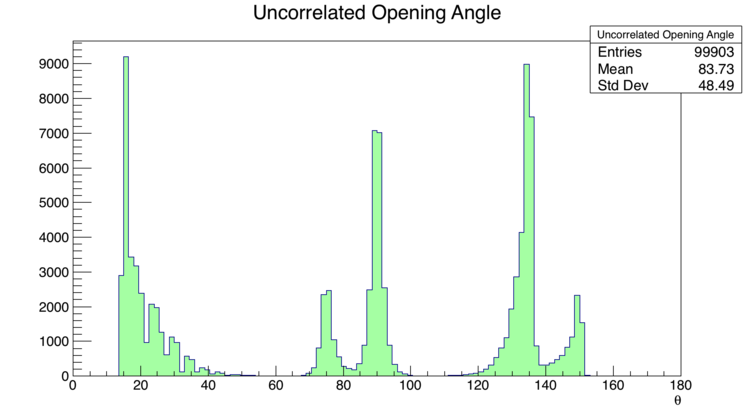
Opening angles
Uncorrelated distribution from detectors 1-4:
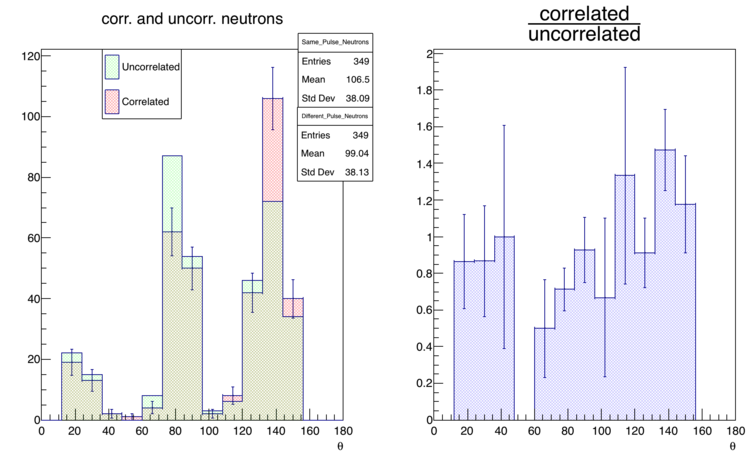
Analyzing 5653446 pulses from DU runs, I was able to find 349 two-neutron events in detectors 1-4.
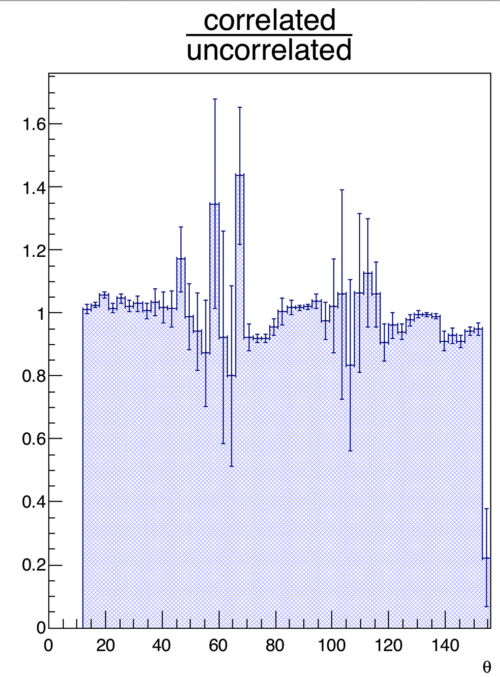
As a test I did the same for gamma events:
Go back 2nCor_44
