Apparatus
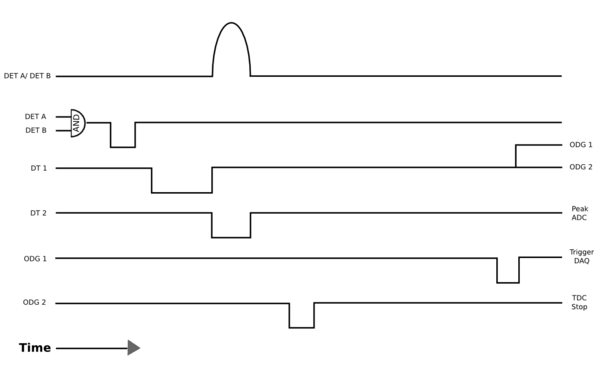
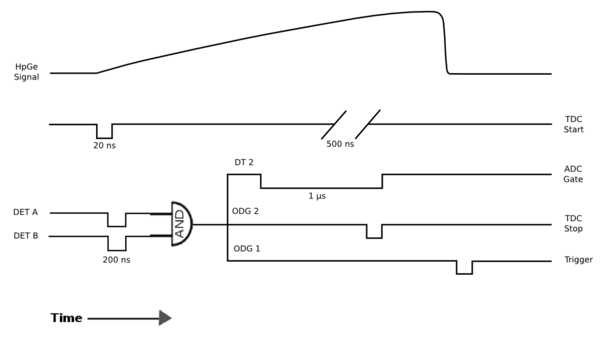
The coincidence counting set-up and modules path are as follows. A source is set atop a base constructed of hydrogen dense blocks. These were chosen to reduce the number of background energy spikes detected. The source is placed an equal distance from decorator A and detector B.
Detector A is positioned directly above the source. A high-purity germanium detector is being utilized for this set-up. The one outgoing signal enters a ORTEC 673 Spectroscopy Amplifier and the outgoing signal then passes through a CANBERRA CFD 2035A. The signal can then enter an optional CAEN CFD to produce a time delay, or can pass directly into a channel (1) of the Level Translator. The second outgoing signal from the Spec Amp goes to a peak sensing CAEN V785N. The output from this module goes to the DAQ.
Perpendicular from detector A and placed an equal distance from the source is detector B. This detector can either be a NaI-3 or a germanium detector depending on the source being counted. Detector B’s signal goes to a Post Amplifier and one outgoing signal goes to the above mentioned CAEN V785N and also to the DAQ. The second signal enters a CANBERRA CFD 2035A. The outgoing signal goes to a different channel (4) of the same Level Translator. A ribbon cable on the Level Translator module goes to a Time-to-Digital Converter (TDC) CAEN V775 that is operating in common start mode.
Both channels (1 and 4) of the Level Translator outgoing signal pass to a 3-fold Logic Unit which is used in both OR mode and AND mode to see coincidence lines. This data is collected in the Trig DAQ.
898 keV signal table
[math]\sigma_Cut[/math]
| [math]T_{1/2}[/math] |
Trig |
Signal |
BackG Subtracted |
Fit Parameters |
Signal Area |
Noise Area |
SNR
|
| 0.44 |
coin |
 |
 |
[math]\mu=[/math] 895.744 +/- 5.774e-4 |
[math]\sigma=[/math] 0.8189 +/- 0.0034 |
A= 0.0097 +/- 0.0013 |
B= 4.891e-9 +/- 6.707e-9 |
C= 2.543e-5 +/- 1.053e-4 |
0.0217 +/- 6.383e-4 |
4.643e-4 +/- 5.804e-5 |
46.678 +/- 0.0124
|
| 0.98 |
sing |
 |
 |
[math]\mu=[/math] 897.255 +/- 0.0047 |
[math]\sigma=[/math] 0.7277 +/- 0.0280 |
A=0.7027 +/- 0.0129 |
B= 8.448e-4+/- 4.457e-5 |
C=-0.7355 +/- 0.0408 |
1.2938 +/- 0.0381 |
0.3123 +/- 0.0390 |
4.143 +/- 0.6977
|
| coin |
 |
 |
[math]\mu=[/math] 896.818 +/- 0.0075 |
[math]\sigma=[/math] 0.9856 +/- 0.0276 |
A= 0.0020 +/- 2.036e-5 |
B= 1.263e-8 +/- 7.797e-10 |
C= 1.095e-5 +/- 5.103e-7 |
0.0049 +/- 1.446e-4 |
9.518e-5 +/- 1.190e-5 |
51.591 +/- 0.0036
|
| 1.46 |
sing |
 |
 |
[math]\mu=[/math] 897.663 +/- 0.00987 |
[math]\sigma=[/math] 0.8348 +/- 0.0580 |
A=0.3925 +/- 0.1107 |
B=-2.696e-4 +/- 2.725e-7 |
C= 0.2633 +/- 1.939e-4 |
1.075 +/- 0.0316 |
0.0777 +/- 0.0097 |
13.827 +/- 0.3763
|
| coin |
 |
 |
[math]\mu=[/math] 897.780 +/- 0.0025 |
[math]\sigma=[/math] 0.9737 +/- 0.0186 |
A= 1.679e-3 +/- 5.996e-7 |
B= 1.217e-8 +/- 7.211e-11 |
C= 1.098e-5 +/- 2.962e-8 |
3.987e-3 +/- 1.174e-4 |
8.732e-5 +/- 1.092e-5 |
45.661 +/- 0.0030
|
| 2.12 |
sing |
 |
 |
[math]\mu=[/math] 894.701 +/- 0.0127 |
[math]\sigma=[/math] 0.6371 +/- 0.0569 |
A=0.3740 +/- 6.200e-5 |
B= 8.285e-5+/- 4.503e-8 |
C=-0.0482+/- 5.103e-7 |
0.6212 +/- 0.0183 |
0.0723 +/- 0.0090 |
8.588 +/- 0.3858
|
| coin |
 |
 |
[math]\mu=[/math] 890.896 +/- 0.0144 |
[math]\sigma=[/math] 1.137 +/- 0.0056 |
A= 7.293e-4 +/- 8.083e-9 |
B= 8.441e-7 +/- 6.284e-11 |
C= -7.342e-4 +/- 2.106e-7 |
0.00199 +/- 5.872e-5 |
8.296e-5 +/- 1.037e-5 |
24.032 +/- 0.0015
|
| 2.27 |
sing |
 |
 |
[math]\mu=[/math] 903.478 +/- 0.0064 |
[math]\sigma=[/math] 0.7121 +/-0.0877 |
A=0.2929 +/- 2.373e-4 |
B= -7.136e-4+/- 1.414e-9 |
C= 0.6715 +/- 1.777e-4 |
0.5609+/- 0.0165 |
0.0862 +/- 0.0108 |
6.505 +/- 0.3063
|
| coin |
 |
 |
[math]\mu=[/math] 905.932 +/- 0.0050 |
[math]\sigma=[/math] 0.8066 +/- 0.0236 |
A= 5.888e-4 +/- 2.063e-7 |
B= 1.238e-6 +/- 4.497e-10 |
C= -1.106e-3 +/- 4.701e-7 |
1.170e-3 +/- 3.446e-5 |
5.310e-5 +/- 6.638e-6 |
22.033 +/- 8.137e-4
|
Re-Fit of Run 7203 without Event Cuts
| [math]T_{1/2}[/math] |
Trig |
Signal |
BackG Subtracted |
Fit Parameters |
Signal Area |
Noise Area |
SNR
|
| 2.12 |
sing |
 |
 |
[math]\mu=[/math] 894.859 +/- 0.0377 |
[math]\sigma=[/math] 0.8294 +/- 0.0389 |
A= 0.1064 +/- 1.281e-4 |
B=4.131e-4 +/- 3e-9 |
C= -0.3439 +/- 1.047e-4 |
0.2214 +/- 0.0065 |
0.0900 +/- 0.0113 |
2.459 +/- 0.0082
|
Re-Fit of Run 7203 without Event Cuts and Scaled by 1.66
| [math]T_{1/2}[/math] |
Trig |
Signal |
BackG Subtracted |
Fit Parameters |
Signal Area |
Noise Area |
SNR
|
| 2.12 |
sing |
 |
 |
[math]\mu=[/math] 894.901 +/- 0.0878 |
[math]\sigma=[/math] 0.8380 +/- 0.0389 |
A= 0.1774 +/- 4.505e-4 |
B=4.931e-5 +/- 9.842e-7 |
C= -2.231e-3 +/- 9.027e-4 |
0.3731 +/- 0.0110 |
0.1532 +/- 0.0192 |
2.435 +/- 0.1543
|
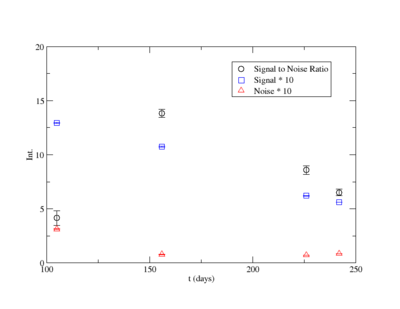
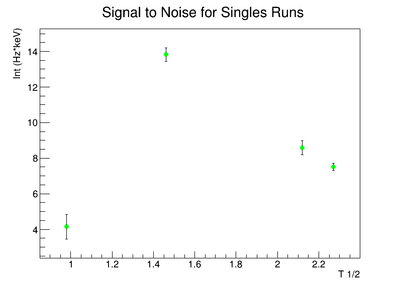
Signal, Noise, and Signal to Noise Ratio plots for 898 keV singles runs.
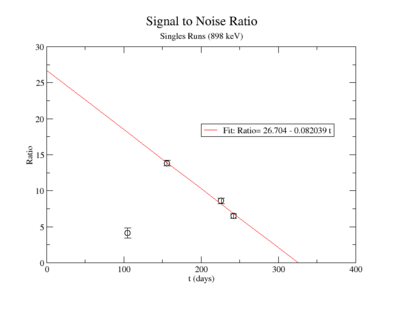
Averaging over the last three noise values:
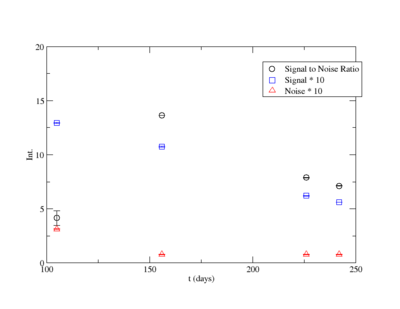
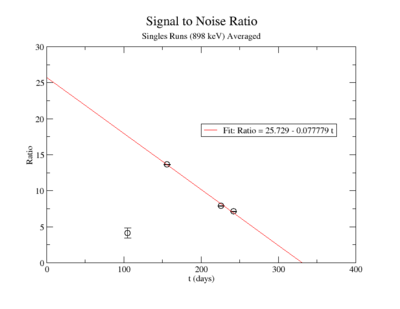
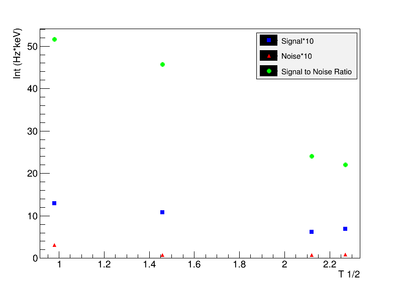
Signal, Noise, and Signal to Noise Ratio plots for 898 keV coincidence runs.
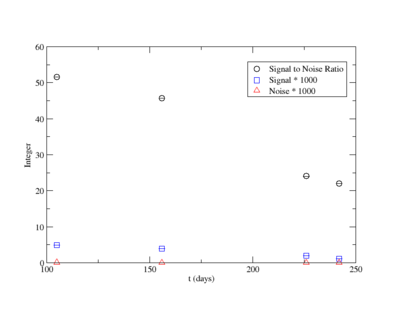
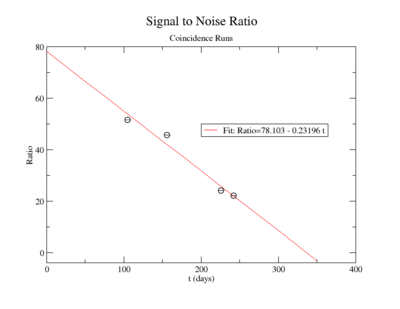
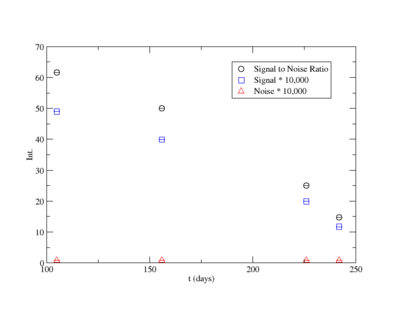
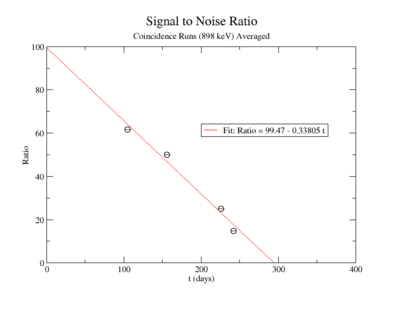
Averaging over the noise values:
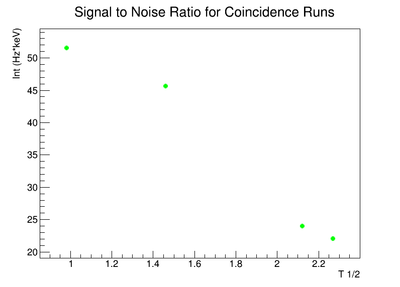
Signal to Noise Ratio (Singles and Coincidence):
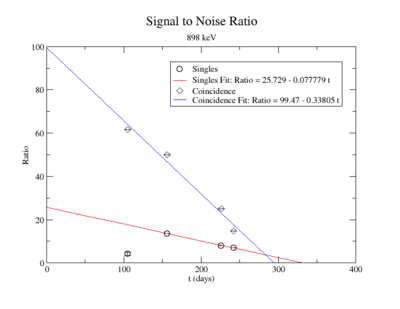
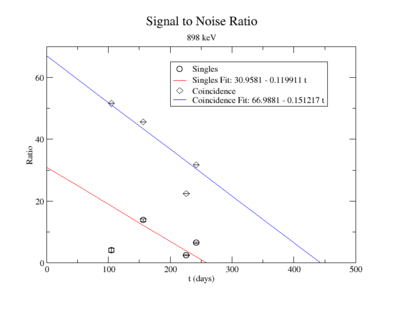
1836 keV signal table
1836.1 keV Signal Table
| [math]T_{1/2}[/math] |
Trig |
Signal |
BackG Subtracted |
Fit Parameters |
Signal Area |
Noise Area |
SNR
|
| 0.44 |
coin |
 |
 |
[math]\mu=[/math] 1833.43 +/- 0.0058 |
[math]\sigma=[/math] 1.447 +/- 0.0228 |
A= 0.0036 +/- 5.937e-7 |
B= 1.129e-6 +/- 9.991e-10 |
C=-2.041e-3 +/- 1.682e-6 |
0.0127 +/- 3.752e-4 |
1.937e-4 +/- 2.421e-5 |
65.781 +/- 0.0096
|
| 0.98 |
sing |
 |
 |
[math]\mu=[/math] 1837.7 +/- 0.02 |
[math]\sigma=[/math] 1.126 +/- 0.0264 |
A=0.3115 +/- 9.318e-6 |
B=3.759e-5 +/- 2.793e-7 |
C=-6.575e-2 +/- 5.102e-4 |
0.8590 +/- 0.0253 |
0.0200 +/- 0.0025 |
42.920 +/- 0.6349
|
| coin |
 |
 |
[math]\mu=[/math] 1835.86 +/- 0.01 |
[math]\sigma=[/math] 1.406 +/- 0.0201 |
A= 0.0018 +/- 2.541e-7 |
B= 4.930e-9 +/- 5.263e-11 |
C= 8.945e-6 +/- 8.814e-8 |
0.0063 +/- 1.853e-4 |
1.037e-4 +/- 1.297e-5 |
60.662 +/- 0.0047
|
| 1.46 |
sing |
 |
 |
[math]\mu=[/math]1838.65 +/- 0.0436 |
[math]\sigma=[/math] 1.117 +/- 0.0569 |
A=0.1757 +/- 3.782e-5 |
B=2.046e-4 +/- 1.5e-9 |
C=-3.713e-1 +/- 4.940e-5 |
0.4933 +/- 0.0145 |
0.0234 +/- 0.0029 |
21.115 +/- 0.3456
|
| coin |
 |
 |
[math]\mu=[/math] 1838.003 +/- 0.0115 |
[math]\sigma=[/math] 1.854 +/- 0.0242 |
A= 9.717e-4 +/- 4.374e-7 |
B= 7.051e-7 +/- 1.119e-10 |
C=-1.291e-3 +/- 1.738e-7 |
0.0044+/- 1.286e-4 |
4.248e-5 +/- 5.309e-6 |
102.838 +/- 0.0033
|
| 2.12 |
sing |
 |
 |
[math]\mu=[/math] 1831.333 +/- 0.2887 |
[math]\sigma=[/math] 0.5219 +/- 0.0555 |
A= 0.1601+/- 1.321e-4 |
B=-1.429e-6 +/- 1.565e-10 |
C=2.260e-2 +/- 5.944e-7 |
0.2214 +/- 0.0065 |
0.0462 +/- 0.0058 |
4.796 +/- 0.1192
|
| coin |
 |
 |
[math]\mu=[/math] 1824.26 +/- 0.0153 |
[math]\sigma=[/math] 1.570 +/- 0.0871 |
A= 5.842e-4 +/- 1.552e-5 |
B= -7.557e-7 +/- 6.718e-11 |
C= 1.405e-3 +/- 1.754e-7 |
0.0024 +/- 7.002e-5 |
1.802e-4 +/- 2.252e-5 |
13.198 +/- 0.0016
|
| 2.27 |
sing |
 |
 |
[math]\mu=[/math] 1850.08 +/- 0.0361 |
[math]\sigma=[/math] 1.238 +/- 0.1486 |
A=0.0741 +/- 3.058e-4 |
B=4.389e-4 +/- 5.774e-10 |
C=-8.040e-1 +/- 1.270e-4 |
0.2471+/- 0.0073 |
0.0451 +/- 0.0056 |
5.478 +/- 0.1354
|
| coin |
 |
 |
[math]\mu=[/math] 1854.58 +/- 0.1587 |
[math]\sigma=[/math] 1.696+/- 0.1625 |
A= 3.873e-4 +/- 8.569e-7 |
B= -9.482e-7 +/- 7.143e-11 |
C= 0.0018 +/-3.216e-7 |
0.0017 +/- 5.083e-5 |
1.623e-5 +/- 2.028e-6 |
106.360 +/- 0.0012
|
Re-Fit of Run 7203 without Event Cuts
| [math]T_{1/2}[/math] |
Trig |
Signal |
BackG Subtracted |
Fit Parameters |
Signal Area |
Noise Area |
SNR
|
| 2.12 |
sing |
 |
 |
[math]\mu=[/math]1831.55 +/- 1.74 |
[math]\sigma=[/math]0.6455 +/- 0.0693 |
A= 0.0658 +/- 0.0007 |
B= 7.775e-6+/- 1.615e-7 |
C= -7.311e-3 +/- 2.991e-4 |
0.1139 +/- 0.0034 |
0.0216 +/- 0.0027 |
5.282 +/- 0.0598
|
Re-Fit of Run 7236 without Event Cuts
| [math]T_{1/2}[/math] |
Trig |
Signal |
BackG Subtracted |
Fit Parameters |
Signal Area |
Noise Area |
SNR
|
| 2.12 |
sing |
 |
 |
[math]\mu=[/math] 1860.48 +/- 0.0874 |
[math]\sigma=[/math]7.160 +/- 0.5751 |
A= 7.067e-5 +/- 1.151e-6 |
B= 8.389e-9+/- 1.764e-8 |
C= -1.293e-5 +/- 3.280e-5 |
0.0013 +/- 3.914e-5 |
0.0021 +/- 0.0003 |
0.6289 +/- 0.0007
|
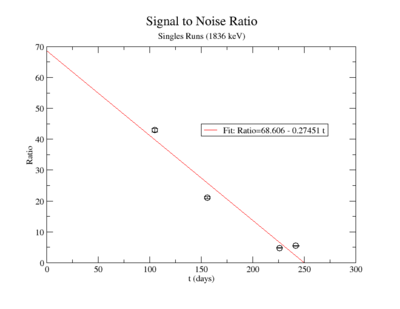
Signal, Noise, and Signal to Noise Ratio plots for 1836 keV singles runs.
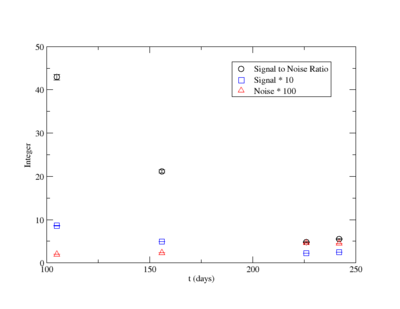
Signal, Noise, and Signal to Noise Ratio plots for 1836 keV coincidence runs.
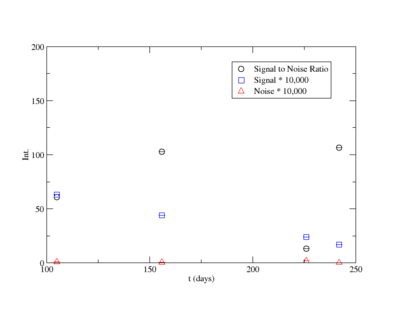
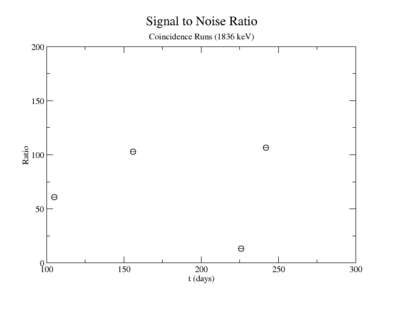
Averaging over the noise values:
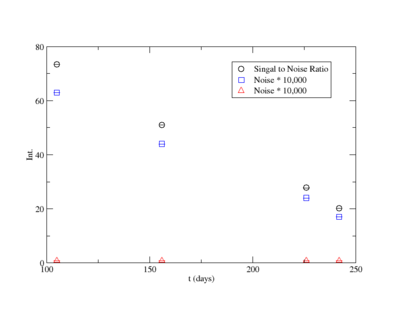
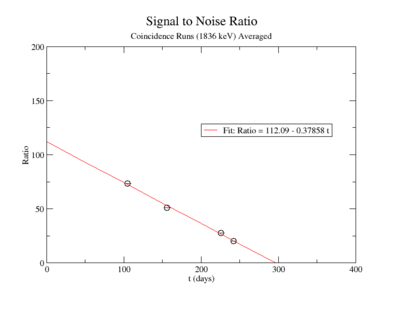
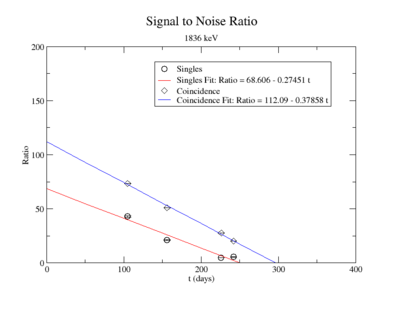
Signal to Noise Ratio (Singles and Coincidence):
Error analysis
Half-life
Values
898 keV Singles
| Days |
[math]T_{1/2}[/math] |
Trig |
Energy Window |
Energy Calibration |
Linear Fit of Background |
Gaussian Integration of Signal |
Total Systematic Error
|
| 105 |
0.98 |
sing |
[math] {+0.005} \atop { -0.009}[/math] |
[math] {+0.014} \atop { -0.025}[/math] |
[math]\pm 0.0025[/math] |
[math]\pm 0.07[/math] |
[math] {+0.073} \atop { -0.078}[/math]
|
| 156 |
1.46 |
sing |
[math] {+0.0062} \atop { -0.032}[/math] |
[math] {+0.0071} \atop { -0.0212}[/math] |
[math] {+0.0065} \atop { -0.0063}[/math] |
[math]\pm 0.0547[/math] |
[math] {+0.057} \atop { -0.077}[/math]
|
| 226 |
2.12 |
sing |
[math] {+0.1554} \atop { -0.1128}[/math] |
[math] {+0.0562} \atop { -0.0774}[/math] |
[math] {+0.0128} \atop { -0.0122}[/math] |
[math]\pm 0.0174[/math] |
[math] {+0.213} \atop { -0.191}[/math]
|
| 242 |
2.27 |
sing |
[math] {+0.0069} \atop { -0.0481}[/math] |
[math] {+0.0246} \atop { -0.0697}[/math] |
[math]\pm 0.01[/math] |
[math]\pm 0.062[/math] |
[math] {+0.07} \atop { -0.133}[/math]
|
898 keV Coincidence
| Days |
[math]T_{1/2}[/math] |
Trig |
Energy Window |
Energy Calibration |
Linear Fit of Background |
Gaussian Integration of Signal |
Coincidence Energy |
Total Systematic Error
|
| 105 |
0.98 |
coin |
[math] {+2.9e-5} \atop { -2.1e-5}[/math] |
[math] \pm 1.6e-5[/math] |
[math] {+7.358e-6} \atop { -7.092e-6}[/math] |
[math]\pm 0.00018[/math] |
[math] {+5.68e-4} \atop { -1.75e-3}[/math] |
[math] {+6.39e-4} \atop { -1.8e-3}[/math]
|
| 156 |
1.46 |
coin |
[math] {+1.7e-5} \atop { -2.0e-6}[/math] |
[math] \pm 1.6e-5[/math] |
[math] {+2.004e-6} \atop { -1.990e-6}[/math] |
[math] {+7.611e-5} \atop { -7.605e-5}[/math] |
[math] {+4.03e-4} \atop { -6.22e-4}[/math] |
[math] {+4.43e-4} \atop { -6.45e-4}[/math]
|
| 226 |
2.21 |
coin |
[math] {+2.0e-5} \atop { -1.06e-4}[/math] |
[math] {+3.5e-5} \atop { -6.8e-5}[/math] |
[math] {+8.041e-6} \atop { -7.859e-6}[/math] |
[math]\pm 0.00013[/math] |
[math] {+4.92e-4} \atop { -1.06e-3}[/math] |
[math] {+5.62e-4} \atop { -1.24e-3}[/math]
|
| 242 |
2.27 |
coin |
[math] {+3.0e-6} \atop { -1.0e-6}[/math] |
[math] {+2.0e-6} \atop { -8e-6}[/math] |
[math] {+4.436e-6} \atop { -4.365e-6}[/math] |
[math]\pm 1.078e-5[/math] |
[math] {+3.63e-4} \atop { -1.52e-3}[/math] |
[math] {+3.68e-4} \atop { -1.53e-3}[/math]
|
1836.1 keV Singles
| Days |
[math]T_{1/2}[/math] |
Trig |
Energy Window |
Energy Calibration |
Linear Fit of Background |
Gaussian Integration of Signal |
Total Systematic Error
|
| 105 |
0.98 |
sing |
[math] {+0.001} \atop { -8.0e-4}[/math] |
[math]\pm 0.0028[/math] |
[math] {+0.0051} \atop { -0.0049}[/math] |
[math]\pm 0.0197[/math] |
[math]\pm 0.021[/math]
|
| 156 |
1.46 |
sing |
[math] {+0.001} \atop { -0.004}[/math] |
[math] {+0.0141} \atop { -0.0071}[/math] |
[math]\pm 0.0014[/math] |
[math]\pm 0.0240[/math] |
[math] {+0.028} \atop { -0.026}[/math]
|
| 226 |
2.12 |
sing |
[math] {+0.0288} \atop { -0.0211}[/math] |
[math] {+0.0122} \atop { -0.0244}[/math] |
[math] {+0.0092} \atop { -0.0085}[/math] |
[math] {+0.0321} \atop { -0.0320}[/math] |
[math] {+0.053} \atop { -0.056}[/math]
|
| 242 |
2.27 |
sing |
[math] {+6.0e-4} \atop { -0.013}[/math] |
[math]\pm 0.0041[/math] |
[math] {+0.0055} \atop { -0.0054}[/math] |
[math] {+0.027} \atop { -0.0272}[/math] |
[math] {+0.028} \atop { -0.033}[/math]
|
1836.1 keV Coincidence
| Days |
[math]T_{1/2}[/math] |
Trig |
Energy Window |
Energy Calibration |
Linear Fit of Background |
Gaussian Integration of Signal |
Coincidence Energy Cut |
Total Systematic Error
|
| 105 |
0.98 |
coin |
[math] {+3.8e-5} \atop { -3.4e-5}[/math] |
[math] {+3.2e-5} \atop { -3.1e-5}[/math] |
[math] {+2.505e-6} \atop { -2.475e-6}[/math] |
[math]\pm 8.97e-5[/math] |
[math] {+3.11e-4} \atop { -2.57e-3}[/math] |
[math] {+3.91e-4} \atop { -2.64e-3}[/math]
|
| 156 |
1.46 |
coin |
[math] {+2.0e-5} \atop { -9.0e-6}[/math] |
[math] {+1.2e-5} \atop { -3.7e-5}[/math] |
[math] {+3.422e-6} \atop { -3.347e-6 }[/math] |
[math]\pm 5.83e-5[/math] |
[math] {+4.63e-4} \atop { -2.82e-3}[/math] |
[math] {+4.98e-4} \atop { -2.87e-3}[/math]
|
| 226 |
2.12 |
coin |
[math] {+3.9e-5} \atop { -1.58e-4}[/math] |
[math] {+6.9e-5} \atop { -13.6e-5}[/math] |
[math] {+1.515e-5} \atop { -1.481e-5}[/math] |
[math]\pm 2.13e-4[/math] |
[math] {+1.16e-3} \atop { -5.77e-3}[/math] |
[math] {+1.29e-3} \atop { -6.07e-3}[/math]
|
| 242 |
2.27 |
coin |
[math] {+2.0e-6} \atop { -7.0e-6}[/math] |
[math] \pm 3.0e-6[/math] |
[math]\pm 6.18e-6[/math] |
[math]\pm 0.00012 [/math] |
[math] {+4.51e-4} \atop { -1.21e-3}[/math] |
[math] {4.72e-4} \atop { -1.23e-3}[/math]
|
Percent Error
898 keV Singles
| Days |
[math]T_{1/2}[/math] |
Trig |
Energy Window |
Energy Calibration |
Linear Fit of Background |
Gaussian Integration of Signal |
Total Systematic Error
|
| 105 |
0.98 |
sing |
[math] {+0.367%} \atop { -0.660%}[/math] |
[math] {+1.026%} \atop { -1.83%}[/math] |
[math]\pm 0.183%[/math] |
[math]\pm 5.132%[/math] |
[math] {+5.32%} \atop { -5.71%}[/math]
|
| 156 |
1.46 |
sing |
[math] {+0.713%} \atop { -3.68%}[/math] |
[math] {+0.816%} \atop { -2.438%}[/math] |
[math] {+0.747%} \atop { -0.724%}[/math] |
[math]\pm 6.29%[/math] |
[math] {+6.52%} \atop { -8.80%}[/math]
|
| 226 |
2.12 |
sing |
[math] {+32.83%} \atop { -23.83%}[/math] |
[math] {+11.87%} \atop { -16.35%}[/math] |
[math] {+2.7%} \atop { -2.58%}[/math] |
[math]\pm 3.68%[/math] |
[math] {+44.94%} \atop { -40.44%}[/math]
|
| 242 |
2.27 |
sing |
[math] {+1.19%} \atop { -8.28%}[/math] |
[math] {+4.24%} \atop { -12.0%}[/math] |
[math]\pm 1.72%[/math] |
[math]\pm 10.68%[/math] |
[math] {+12.1%} \atop { -22.99%}[/math]
|
898 keV Coincidence
| Days |
[math]T_{1/2}[/math] |
Trig |
Energy Window |
Energy Calibration |
Linear Fit of Background |
Gaussian Integration of Signal |
Coincidence Energy |
Total Systematic Error
|
| 105 |
0.98 |
coin |
[math] {+0.56%} \atop { -0.404%}[/math] |
[math] {+0.31%} \atop { -1.21%}[/math] |
[math] {+0.142%} \atop { -0.136%}[/math] |
[math]\pm 3.46%[/math] |
[math] {+10.92%} \atop { -33.65%}[/math] |
[math] {+12.29%} \atop { -35.44%}[/math]
|
| 156 |
1.46 |
coin |
[math] {+0.405%} \atop { -0.048%}[/math] |
[math] {+0.36%} \atop { -0.31%}[/math] |
[math] {+0.048%} \atop { -0.047%}[/math] |
[math]\pm 1.81%[/math] |
[math] {+9.6%} \atop { -14.8%}[/math] |
[math] {+10.51%} \atop { -12.27%}[/math]
|
| 226 |
2.21 |
coin |
[math] {+0.588%} \atop { -3.12%}[/math] |
[math] {+0.59%} \atop { -1.74%}[/math] |
[math] {+0.237%} \atop { -0.231%}[/math] |
[math]\pm 3.82%[/math] |
[math] {+14.5%} \atop { -31.2%}[/math] |
[math] {+16.11%} \atop { -36.23%}[/math]
|
| 242 |
2.27 |
coin |
[math] {+0.2%} \atop { -0.067%}[/math] |
[math] {+0.13%} \atop { -0.267%}[/math] |
[math] {+0.296%} \atop { -0.291%}[/math] |
[math]\pm 0.719%[/math] |
[math] {+24.2%} \atop { -101.3%}[/math] |
[math] {+24.55%} \atop { -101.67%}[/math]
|
1836.1 keV Singles
| Days |
[math]T_{1/2}[/math] |
Trig |
Energy Window |
Energy Calibration |
Linear Fit of Background |
Gaussian Integration of Signal |
Total Systematic Error
|
| 105 |
0.98 |
sing |
[math] {+0.119%} \atop { -0.095%}[/math] |
[math]\pm 0.33%[/math] |
[math] {+0.606%} \atop { -0.582%}[/math] |
[math]\pm 2.34%[/math] |
[math] {+2.46%} \atop { -2.45%}[/math]
|
| 156 |
1.46 |
sing |
[math] {+0.199%} \atop { -0.798%}[/math] |
[math] {+2.81%} \atop { -1.42%}[/math] |
[math]\pm 0.279%[/math] |
[math]\pm 4.79%[/math] |
[math] {+5.66%} \atop { -5.28%}[/math]
|
| 226 |
2.12 |
sing |
[math] {+10.21%} \atop { -7.48%}[/math] |
[math] {+4.32%} \atop { -8.65%}[/math] |
[math] {+3.26%} \atop { -3.01%}[/math] |
[math] {+11.37%} \atop { -11.34%}[/math] |
[math] {+18.74%} \atop { -19.94%}[/math]
|
| 242 |
2.27 |
sing |
[math] {+0.245%} \atop { -5.31%}[/math] |
[math]\pm 1.674%[/math] |
[math] {+2.246%} \atop { -2.205%}[/math] |
[math] {+11.025%} \atop { -11.107%}[/math] |
[math] {+11.414%} \atop { -13.303%}[/math]
|
1836.1 keV Coincidence
| Days |
[math]T_{1/2}[/math] |
Trig |
Energy Window |
Energy Calibration |
Linear Fit of Background |
Gaussian Integration of Signal |
Coincidence Energy Cut |
Total Systematic Error
|
| 105 |
0.98 |
coin |
[math] {+0.613%} \atop { -0.55%}[/math] |
[math] {+1.27%} \atop { -0.5%}[/math] |
[math]\pm 0.04%[/math] |
[math]\pm 1.45%[/math] |
[math] {+5.02%} \atop { -41.45%}[/math] |
[math] {+7.05%} \atop { -42.52%}[/math]
|
| 156 |
1.46 |
coin |
[math] {+0.435%} \atop { -0.196%}[/math] |
[math] {+0.522%} \atop { -0.804%}[/math] |
[math] {+0.074%} \atop { -0.073% }[/math] |
[math]\pm 1.267%[/math] |
[math] {+10.07%} \atop { -61.3%}[/math] |
[math] {+11.09%} \atop { -62.31%}[/math]
|
| 226 |
2.12 |
coin |
[math] {+0.629%} \atop { -2.55%}[/math] |
[math] {+1.11%} \atop { -1.10%}[/math] |
[math] {+0.244%} \atop { -0.239%}[/math] |
[math]\pm 3.44%[/math] |
[math] {+18.71%} \atop { -93.06%}[/math] |
[math] {+20.74%} \atop { -96.77%}[/math]
|
| 242 |
2.27 |
coin |
[math] {+0.125%} \atop { -0.438%}[/math] |
[math] {+0.125%} \atop { -0.188%}[/math] |
[math]\pm 0.386% [/math] |
[math]\pm 7.5% [/math] |
[math] {+28.2%} \atop { -75.6%}[/math] |
[math] {29.41%} \atop { -76.62%}[/math]
|
SNR
The signal to noise ratio is
| Days |
[math]T_{1/2}[/math] |
Trig |
SNR |
Statistical Error |
Systematic Error
|
| 105 |
0.98 |
sing |
42.07 |
[math]\pm 0.0483[/math] |
[math]\pm 0.0197[/math]
|
| coin |
9.65 |
[math]\pm 1.04e-3 [/math] |
[math] {+1.47e-4} \atop { -1.11e-4}[/math]
|
| 156 |
1.46 |
sing |
21.52 |
[math]\pm 0.0420 [/math] |
[math] {+0.028} \atop { -0.026}[/math]
|
| coin |
7.16 |
[math]\pm 1.02e-3 [/math] |
[math] {+7.31e-5} \atop { -7.43e-5}[/math]
|
| 226 |
2.12 |
sing |
4.64 |
[math]\pm 0.0597 [/math] |
[math] {+0.053} \atop { -0.056}[/math]
|
| coin |
9.65 |
[math]\pm 1.09e-3 [/math] |
[math] {+2.39e-4} \atop { -3.11e-4}[/math]
|
| 242 |
2.27 |
sing |
5.43 |
[math]\pm 0.0325 [/math] |
[math] {+0.028} \atop { -0.033}[/math]
|
| coin |
2.49 |
[math]\pm 9.89e-4 [/math] |
[math] {+1.20e-4} \atop { -1.21e-4}[/math]
|
=other
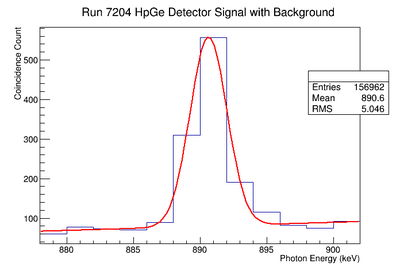
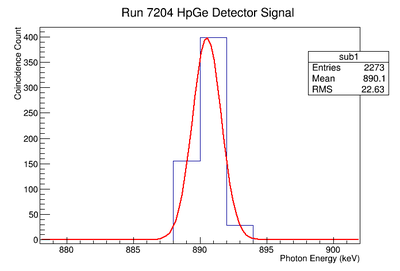
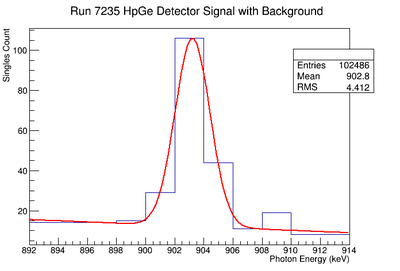
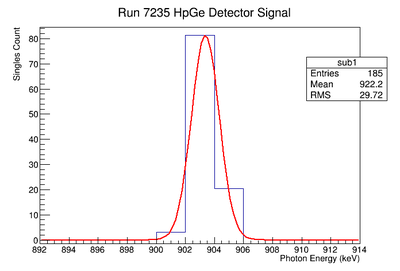
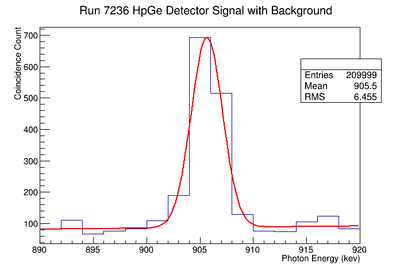
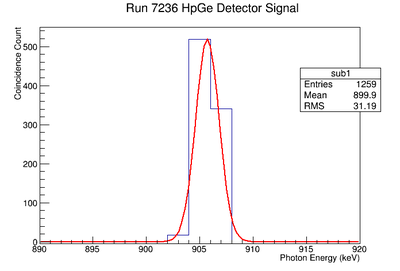
898 keV Signal and Background Noise Table
| Run # |
Area of Signal |
Area of Background |
Signal to Noise Ratio
|
| 7203 |
130.17 |
120.59 |
1.08
|
| 7204 |
825.34 |
558.66 |
1.48
|
| 7235 |
194.38 |
60.23 |
3.23
|
| 7236 |
1429.75 |
436.93 |
3.27
|
A_W_thesis
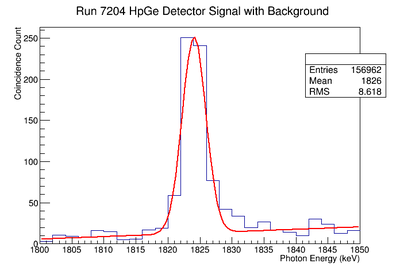
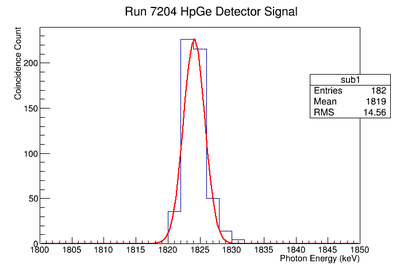
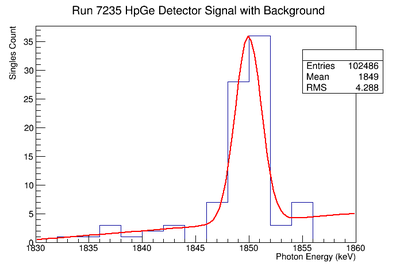
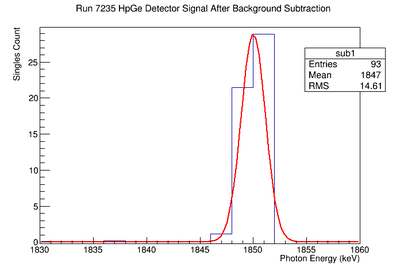
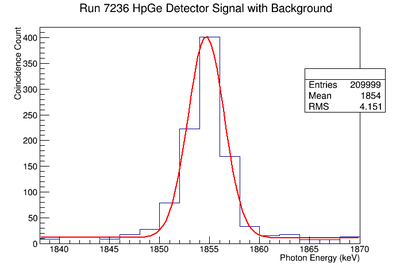
1836.1 keV Signal and Background Noise Table
| Run # |
Area of Signal |
Area of Background |
Signal to Noise Ratio
|
| 7203 |
83.29 |
24.73 |
3.37
|
| 7204 |
944.58 |
101.68 |
9.29
|
| 7235 |
82.25 |
20.90 |
3.94
|
| 7236 |
1849.86 |
97.64 |
18.95
|
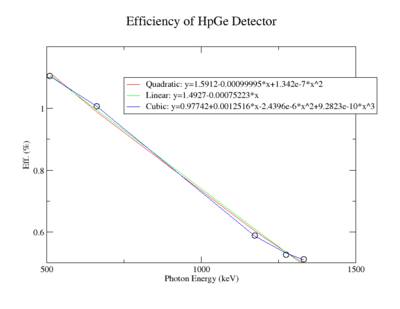
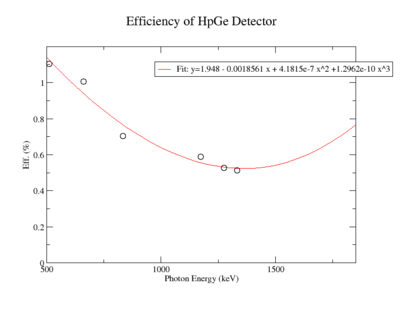
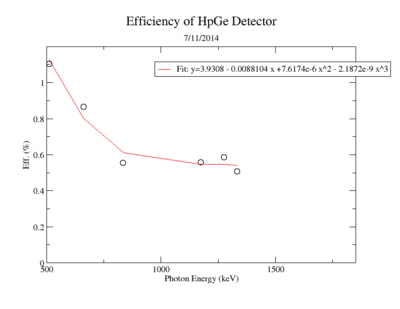
HpGe Detector
| Run |
Source |
Energy |
Expected rate (Hz) |
HpGe Det B Rate (ADC 7) (Hz) |
HpGe Eff (%)
|
| 7027 |
Na-22 |
511 |
1589.218 +/- 49.425 |
18.07 +/- 0.111 |
1.137 +/- 0.0317
|
| 7025 |
Cs-137 |
661.657 |
2548.03 +/- 80.008 |
25.468+/- 0.172 |
0.9995 +/- 0.0321
|
| 7029 |
Mn-54 |
834.848 |
41.405 +/- 1.300 |
0.485 +/- 0.014 |
1.171 +/- 0.0427
|
| 7026 |
Co-60 |
1173.228 |
1876.619 +/- 58.926 |
11.03 +/- 0.106 |
0.588 +/- 0.0328
|
| 7027 |
Na-22 |
1274.537 |
888.264 +/- 27.625 |
4.857 +/- 0.034 |
0.5468 +/- 0.0319
|
| 7026 |
Co-60 |
1332.492 |
1878.167 +/- 58.974 |
9.584 +/- 0.023 |
0.510 +/- 0.0315
|
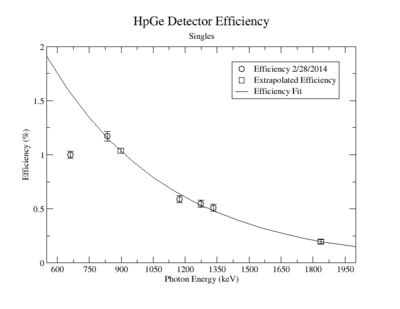
Extrapolated Efficiency
| Source |
Energy |
HpGe Eff (%)
|
| Y-88 |
898 |
1.036 +/- 0.0226
|
| Y-88 |
1836.1 |
0.1983 +/- 0.0178
|
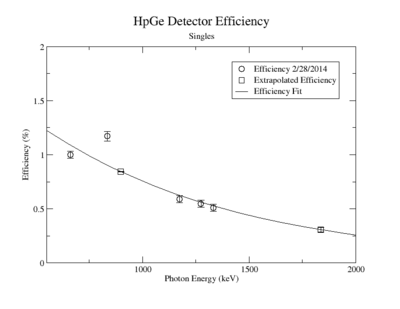
Exp Fit including Cs-137
  1  Constant     7.96246e-01   6.78458e-02   6.83891e-05  -2.33206e-03
  2  Slope       -1.07699e-03   7.10063e-05   7.15739e-08  -2.09517e+00
f(x) = exp(p0+p1*x).
Extrapolated Efficiency
| Source |
Energy |
HpGe Eff (%)
|
| Y-88 |
898 |
0.8429 +/- 0.0034
|
| Y-88 |
1836.1 |
0.3069 +/- 0.0192
|
| Energy |
Trig |
[math]N_0[/math] (before efficiency)
|
| 898 |
sing |
1.281e-8 +/- 2.254e-9
|
| coin |
6.411e-11 +/- 3.572e-12
|
| 1836.1 |
sing |
9.634e-9 +/- 1.102e-9
|
| coin |
8.147e-11 +/- 2.987e-12
|
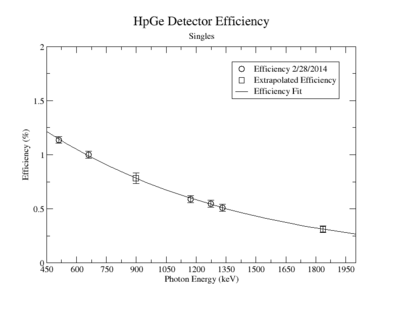
Exp Fit including all Na-22 points and excluding Mn-54
  1  Constant     6.36491e-01   4.70444e-02   1.00271e-05  -3.28621e-03
  2  Slope       -9.81232e-04   5.68236e-05   1.21109e-08  -1.59453e+00
Extrapolated Efficiency
| Source |
Energy |
HpGe Eff (%)
|
| Y-88 |
898 |
0.7830 +/- 0.0471
|
| Y-88 |
1836.1 |
0.3119 +/- 0.0310
|
| Energy |
Trig |
[math]N_0[/math] (before efficiency)
|
| 898 |
sing |
1.281e-8 +/- 2.254e-9
|
| coin |
6.411e-11 +/- 3.572e-12
|
| 1836.1 |
sing |
9.634e-9 +/- 1.102e-9
|
| coin |
8.147e-11 +/- 2.987e-12
|
Efficiency on 2/28/2014
| Run |
Source |
Energy |
Expected rate (Hz) |
HpGe Det B Rate (ADC 7) (Hz) |
HpGe Eff (%)
|
| 7028 |
Ba-133 |
80.9971 |
1067.468 +/- 1.131 |
14.483 +/- 1.442 |
1.357
|
| 7028 |
Ba-133 |
276.3997 |
221.297 +/- 0.2345 |
4.239 +/- 0.9671 |
1.916
|
| 7028 |
Ba-133 |
302.8510 |
574.310 +/- 0.6085 |
9.523 +/- 0.5539 |
1.658
|
| 7028 |
Ba-133 |
356.0134 |
1941.418 +/- 2.057 |
27.130 +/- 1.316 |
1.397
|
| 7028 |
Ba-133 |
383.8480 |
278.416 +/- 0.2950 |
3.982 +/- 0.2440 |
1.430
|
| 7027 |
Na-22 |
511 |
1589.218 +/- 1.842 |
17.545 +/- 0.4560 |
1.104
|
| 7025 |
Cs-137 |
661.657 |
2548.022 +/- 2.222 |
25.622+/- 0.3286 |
1.006
|
| 7029 |
Mn-54 |
834.848 |
4032.782 +/- 0.0114 |
0.2911 +/- 0.1667 |
0.0072
|
| 7026 |
Co-60 |
1173.228 |
1876.619 +/- 0.2687 |
11.062 +/- 0.1215 |
0.589
|
| 7027 |
Na-22 |
1274.537 |
888.264 +/- 1.029 |
4.685 +/- 0.0825 |
0.527
|
| 7026 |
Co-60 |
1332.492 |
1878.167 +/- 0.2690 |
9.616 +/- 0.1181 |
0.512
|
| Run |
Source |
Energy |
Expected rate (Hz) |
NaI Det B Rate (ADC 7) (Hz) |
NaI Eff (%)
|
| 7027 |
Na-22 |
511 |
1589.218 +/- 49.425 |
14.86 +/- 0.0945 |
0.9351 +/- 0.0317
|
| 7025 |
Cs-137 |
661.657 |
2548.03 +/- 80.008 |
23.45 +/- 0.9729 |
0.9203 +/- 0.0520
|
| 7026 |
Co-60 |
1173.228 |
1876.619 +/- 58.926 |
8.001 +/- 0.0953 |
0.4264 +/- 0.0336
|
| 7027 |
Na-22 |
1274.537 |
888.264 +/- 27.625 |
4.05 +/- 0.0247 |
0.4559 +/- 0.0317
|
| 7026 |
Co-60 |
1332.492 |
1878.167 +/- 58.974 |
7.234 +/- 0.1675 |
0.3852 +/- 0.0390
|
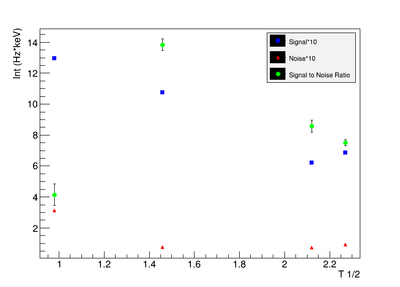
Signal, Noise, and Signal to Noise Ratio plots for 898 keV singles runs.
Signal, Noise, and Signal to Noise Ratio plots for 898 keV coincidence runs.
[math]\sigma_Fit[/math]
| [math]T_{1/2}[/math] |
Trig |
Fit Parameters |
Signal Area |
Noise Area |
SNR
|
| 0.98 |
sing |
[math]\mu=[/math] 897.260 +/- 0.0047 |
[math]\sigma=[/math] 0.7074 +/- 0.0280 |
A=0.725 +/- 0.0129 |
B= 8.448e-4+/- 4.457e-5 |
C=-0.7355 +/- 0.0408 |
0.9938 +/- 0.0054 |
0.3039 +/- 0.0380 |
3.270 +/- 0.0243
|
| coin |
[math]\mu=[/math] +/- |
[math]\sigma=[/math] +/- |
A= +/- |
B= +/- |
C= +/- |
+/- |
+/- |
+/-
|
| 2.27 |
sing |
[math]\mu=[/math] 903.482 +/- 0.0064 |
[math]\sigma=[/math] 0.6595 +/- 0.0877 |
A= 0.3199 +/- 0.0156 |
B= -7.248e-4+/- 9.968e-7 |
C= 6.816e-1 +/- 8.138e-4 |
0.5146 +/- 0.0073 |
0.0852 +/- 0.0107 |
6.037 +/- 0.0082
|
| coin |
[math]\mu=[/math] +/- |
[math]\sigma=[/math] +/- |
A= +/- |
B= +/- |
C= +/- |
+/- |
+/- |
+/-
|
Fit method
Do the fit:
get parameters for line
Then fill 1 histogram with line
Then subtract
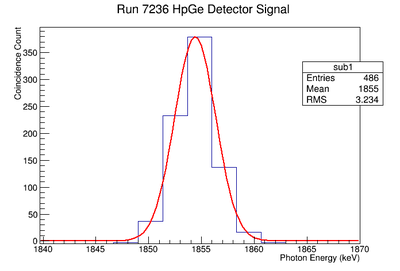
TH1F *coin1=new TH1F("coin1","coin1",30,1800,1860);

ntuple->Draw("ADC7*0.604963-49.7001 >>coin1")

TH1F *lin1=new TH1F("lin1","line1",30,1800,1860);

for(int i=1800;i<1861;i++){
lin1->Fill(i,-2028+1.12*i)
}

TH1F *sub1=new TH1F("sub1","sub1",30,1800,1860);

sub1->Add(coin1,1);
sub1->Add(lin1,-1);

sub1->Draw();
A pdf of the Mathematica notebook used to calculate background area, gaussian area, and plot signal/noise vs. activity.
File:AW Background Noise custom4.pdf
All the ROOT fit parameters used to find the background and the resulting peaks.
File:Y-88 Fit Log Scaled&Cut.pdf
Integrating the gaussian of the HpGe detector signal.
File:AW Gaussian Integral2.pdf
- [math] f(x)=A \textstyle \int_{\mu-2\sigma}^{\mu+2\sigma} e^{-\frac{1}{2}\left(\frac{x-\mu}{\sigma}\right)^2} \operatorname{d}\!x +B x +C[/math]
A_W_thesis


