Image Analysis
Jump to navigation
Jump to search
- The viewer images were analyzed using a perl-PDL [1] package.
- The norf on images were used as a background and subtracted from the the beam on images before analysis.
- The rotation of 6degrees was applied and helped the resulting data look more symmetric when plot against K1*L.
- The region of interest for the projection was determined by first calculating the RMS and then performing a rough fit.
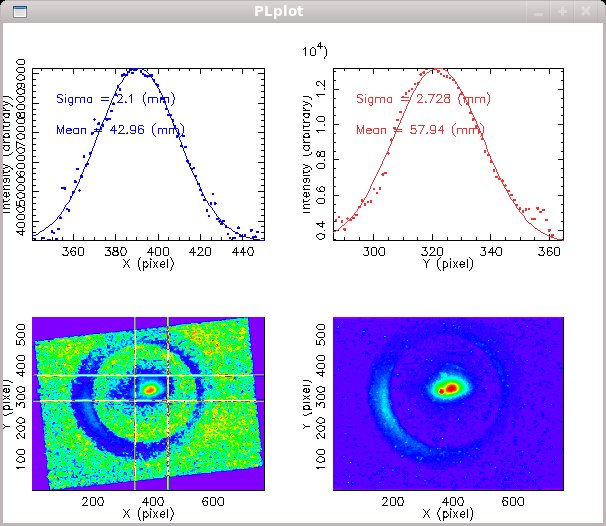
- With the region of interest determined, the X and Y projections were created and fit to a Gaussian distribution.
The figure below shows the projections and images (after rotation and subtraction lower left, raw image lower right) for the first quad scan perform at 4amps.
