FC Analysis
Jump to navigation
Jump to search
FC analysis using ADC channel current distribution
FC analysis using ADC channel current distribution
FC analysis using ADC channel current distribution
FC analysis using ADC channel current distribution
FC analysis using ADC channel current distribution
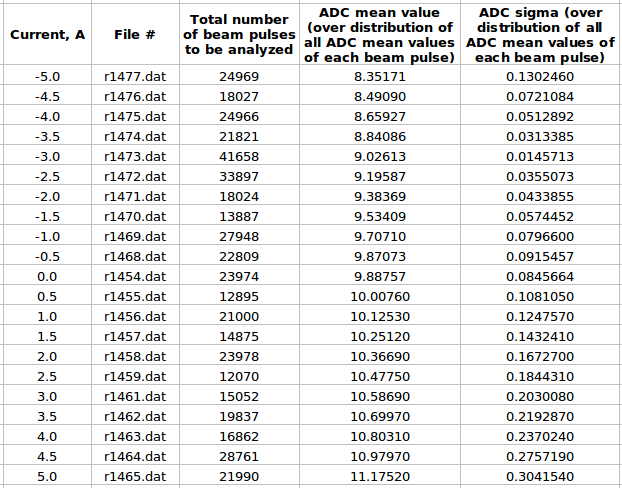
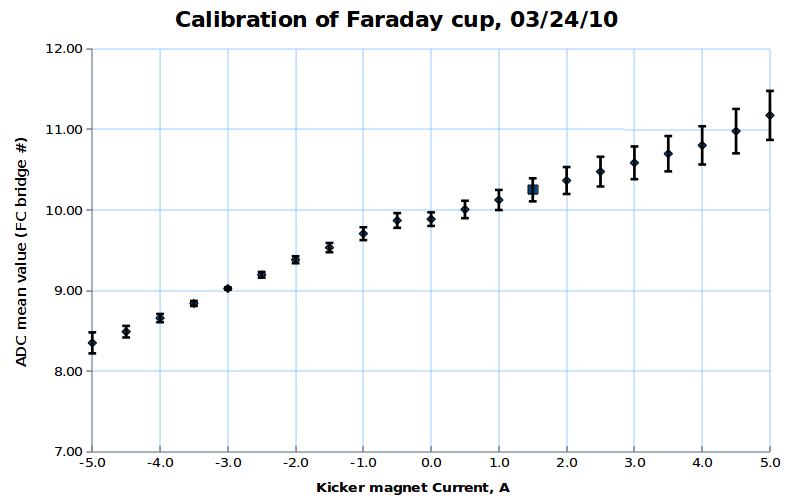
FC analysis using pulse by pulse ADC channel mean value distribution
For each beam pulse:
For distribution over all beam pulses:
Here is:
1. ADC# = bridge#
2. Pulse# = ReadOut# = Entry# = Event#
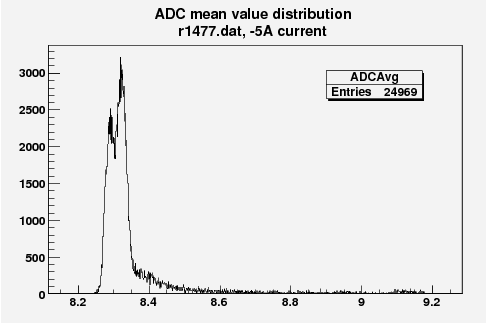
Some examples of ADC mean value distribution. Here are:
1. x axis: ADC mean value for one pulse
2. y axis: number of pulse w/ that ADC mean value
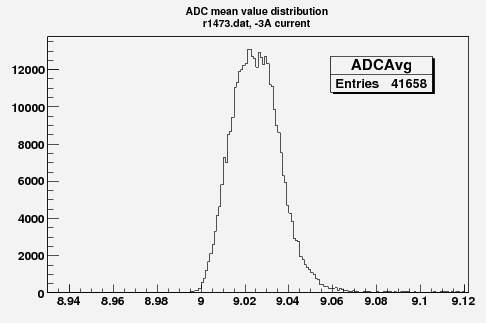
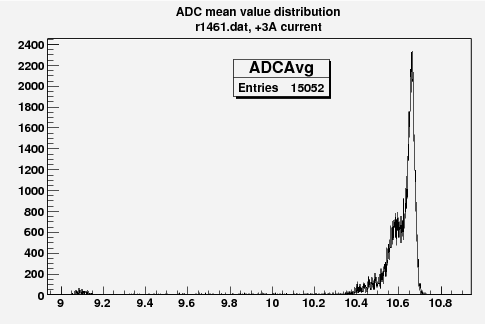
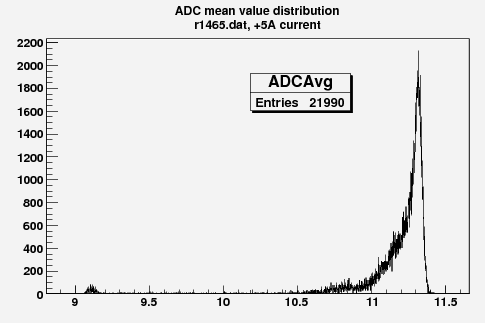
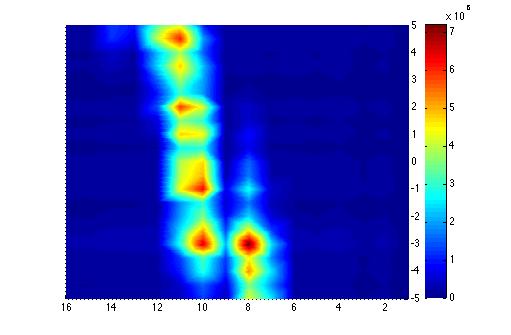
Below is the plot of the charge in Faraday cup (pC) as a function of magnet current (vertical axis, A) (basically magnetic field) and ADC (horizontal axis).
