FC Analysis
Jump to navigation
Jump to search
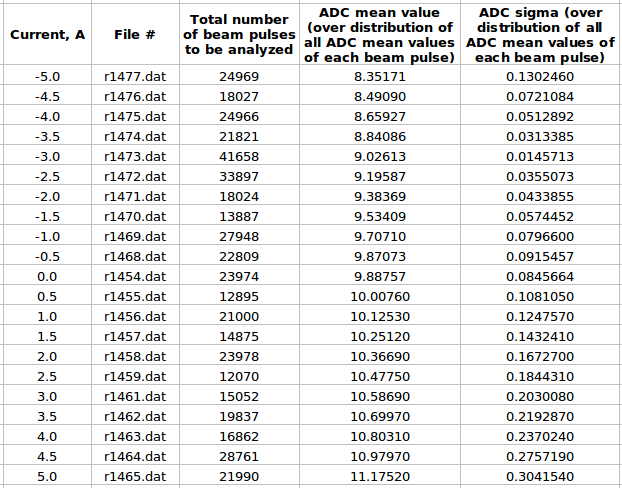
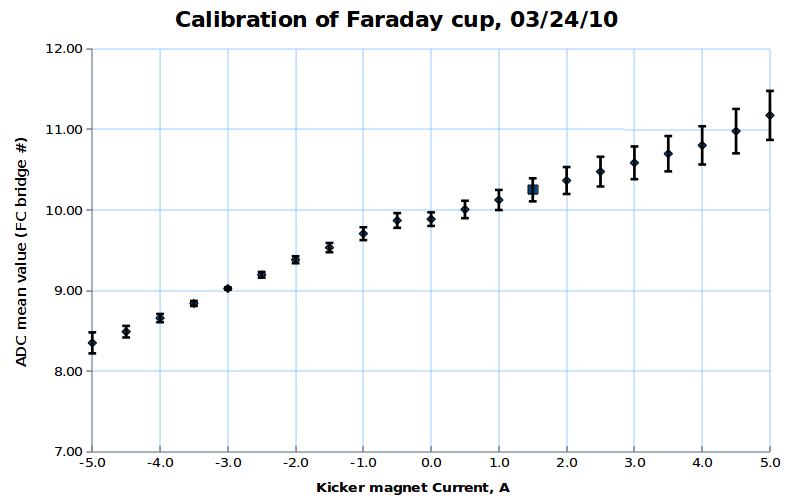
FC analysis using
FC analysis using pulse by pulse ADC channel mean value distribution
For each beam pulse:
For distribution over all beam pulses:
Here is:
1. ADC# = bridge#
2. Pulse# = ReadOut# = Entry# = Event#
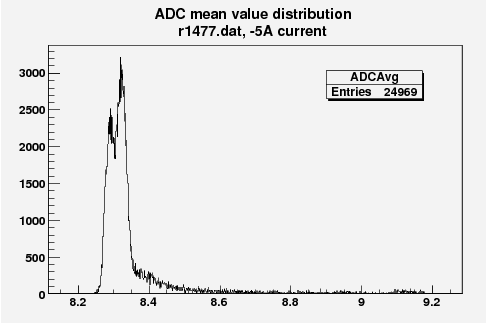
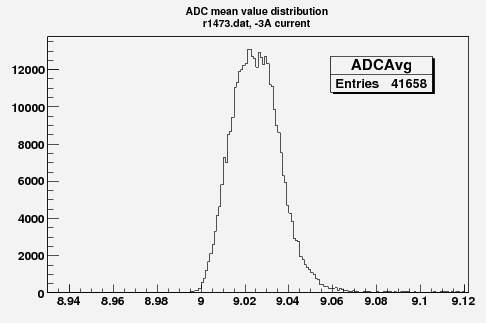
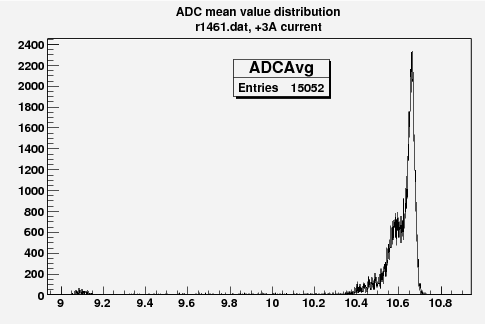
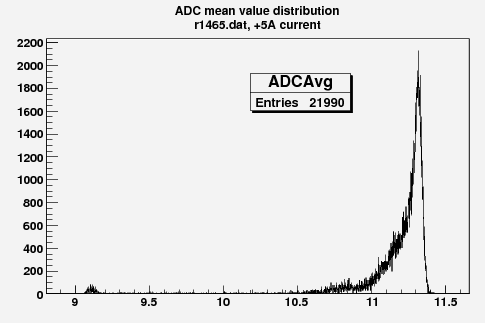
Some examples of ADC mean value distribution. Here are:
1. x axis: ADC mean value for one pulse
2. y axis: number of pulse w/ that ADC mean value
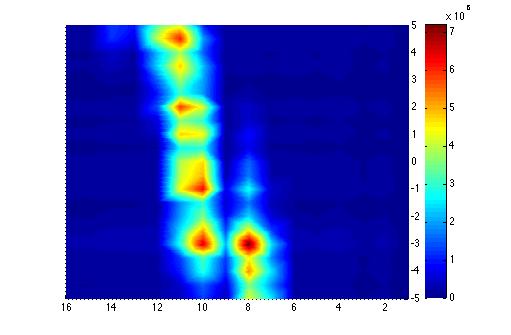
Below is the plot of the charge in Faraday cup (pC) as a function of magnet current (vertical axis, A) (basically magnetic field) and ADC (horizontal axis).
