A kind of analysis
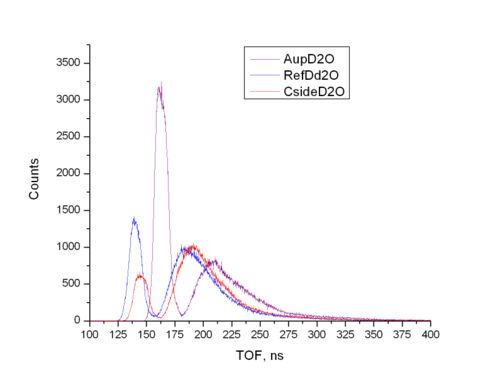
-peak positions are shifted w.r.t. each other due to the difference in TOF conversion (electronics amplification). If we wanna calculate the asymmetry as a function of TOF for each channel (neutron energy) it is necessary to match the positions of centroids of -peaks. However, one needs to take into account the difference between channel-to-TOF calibration coefficients for each detector.
This is what we have if we superimpose TOF-spectra within one plot. It was used used the average channel-to-TOF calibration coefficient (0.179+0.186+0.19)/3 = 0.185 ns/channel (Is it okay to do that?).
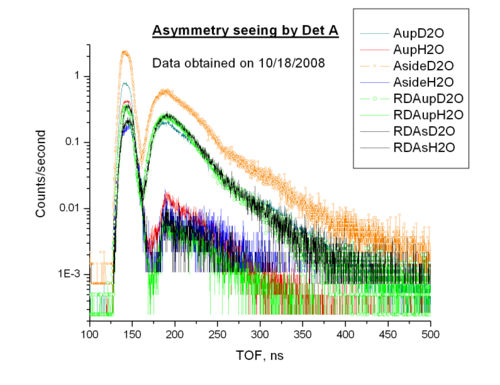
Channel-to-TOF calibration coefficients used was 0.19 ns/channel. -peak positions were matched manually by cutting out the shift in the spectra w.r.t. Ref Det.
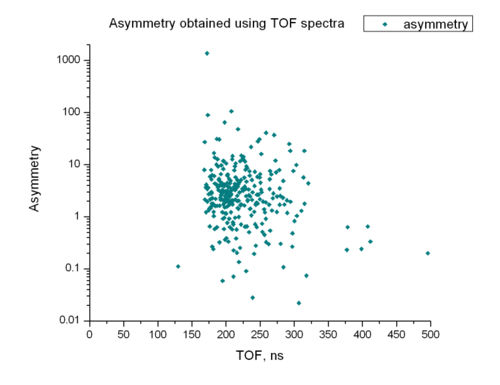
The following plot was drawn using upper plot and formula for calculation of asymmetry placed at [[1]]
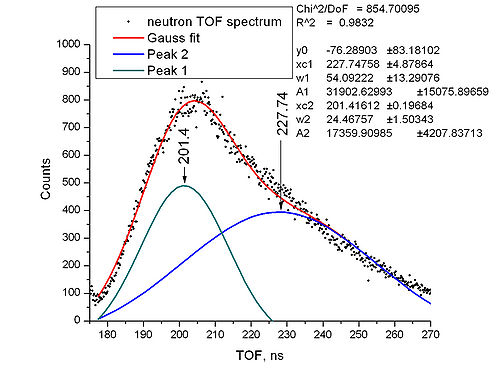
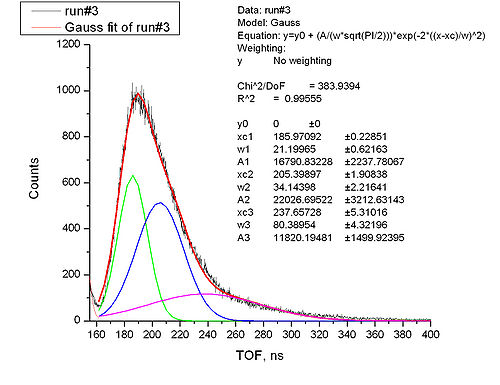
Neutron part of spectrum
We should define how many peaks to use, i.e. we need some physical model for the process we observe.
relations
In the calculation of I will use just integration of area under the curve instead of fitting neutron spectrum with three peaks (I got about 0.36% difference between areas calculated in these two ways).
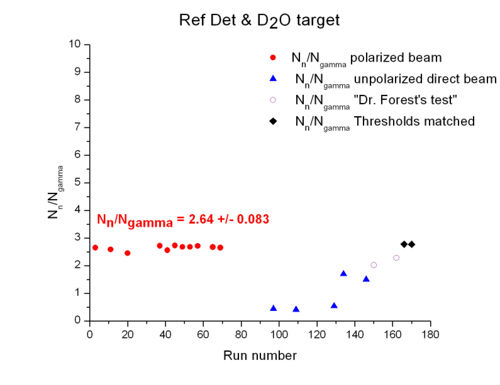
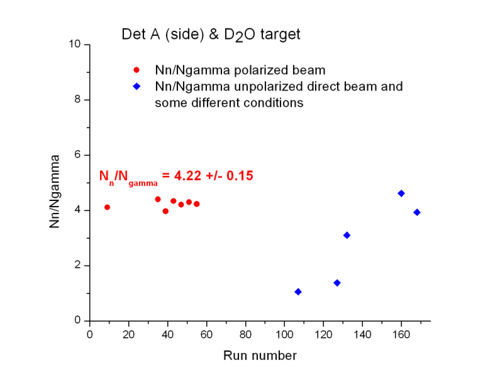
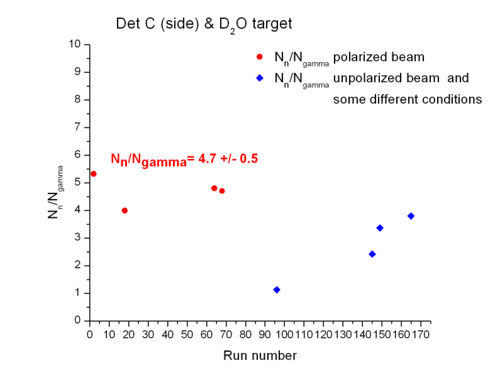
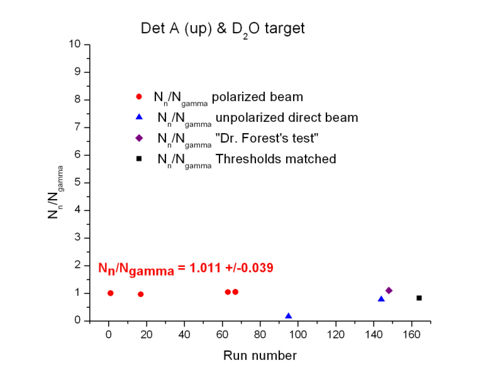
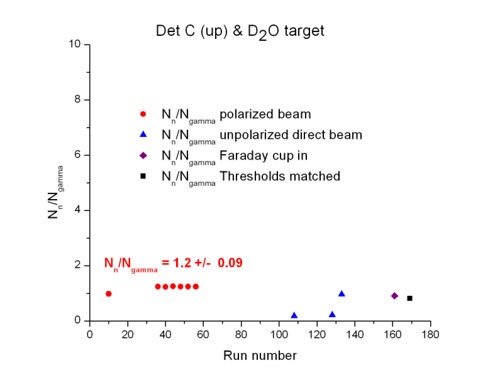
Summary table for averaged over runs w/ polarized beam
| target | Det A (side) | Det C (side) | Det A (up) | Det C (up) | Ref Det |
|---|---|---|---|---|---|
| <> |
