Kalyan 23 May 08
Table of Results
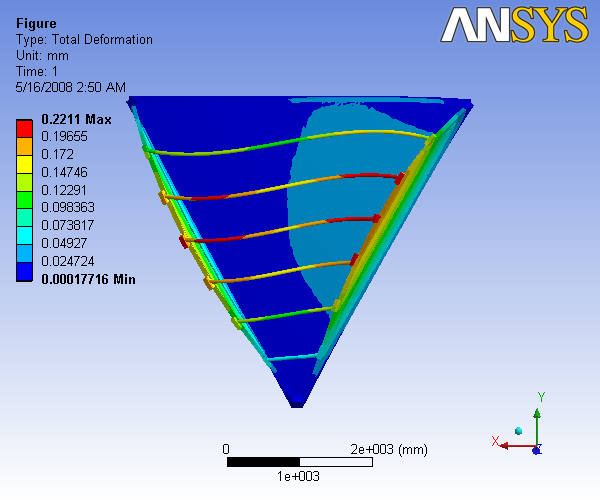
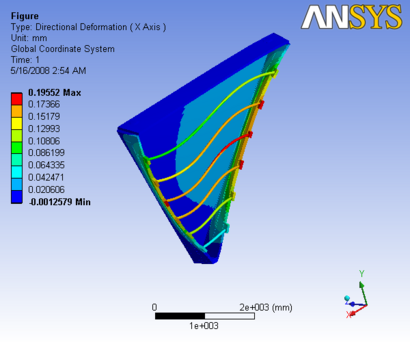
| Deformation (mm) | |||||
| Sector 1 | E Max | D Max | X Max | Y Max | Z Max |
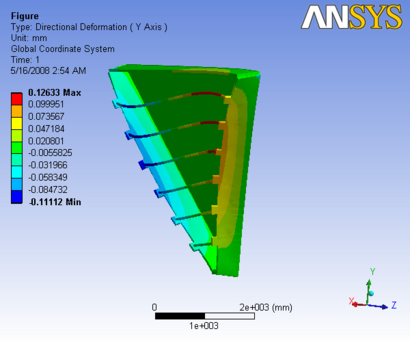
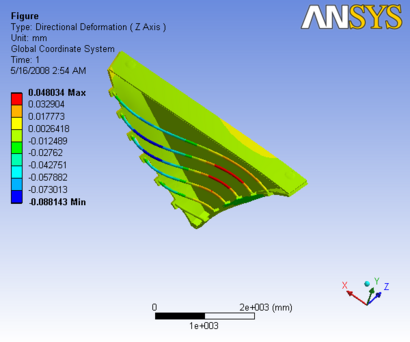
| Hinges in the down stream side | 0.196 | 0.221 | 0.195 | 0.126 | -0.088 |
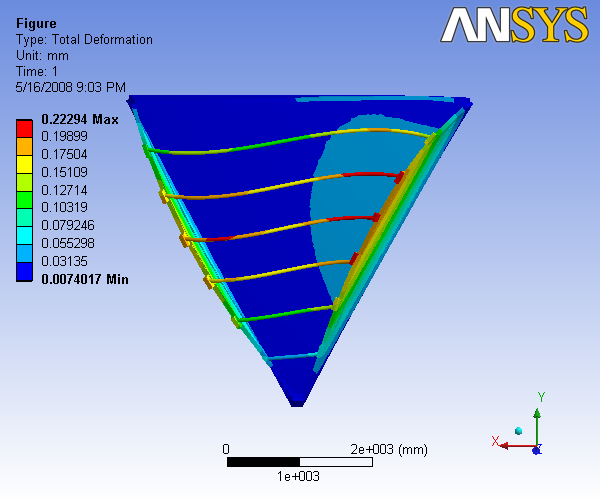
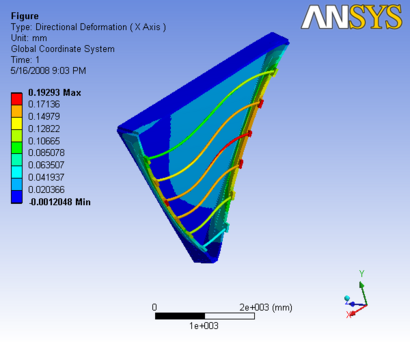
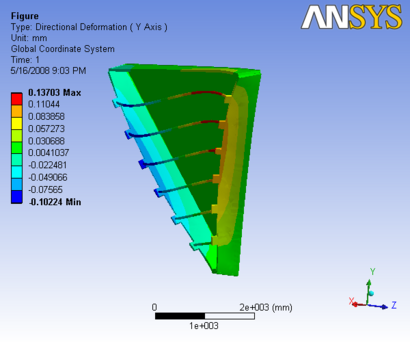
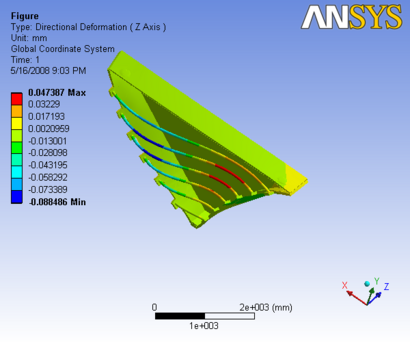
| Hinges in the down stream side | 0.198 | 0.222 | 0.192 | 0.137 | -0.088 |
Hinges on the downstream side
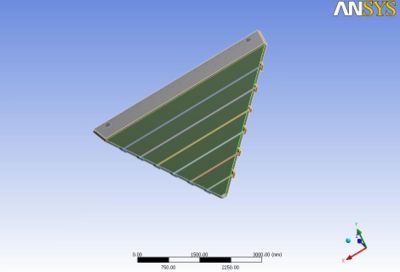
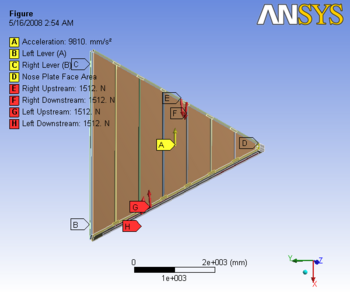
The report generated by ANSYS is available: File:Analysis O slice 1.pdf
 |
 |
|
 |
 |
|
Figure 1: Images of Deflection for Sector 1 with hinges to the down stream side in D,X,Y,Z Directions respectively
Hinges on the upstream side
The report generated by ANSYS is available: File:Analysis O slice 1a.pdf
 |
 |
|
 |
 |
|
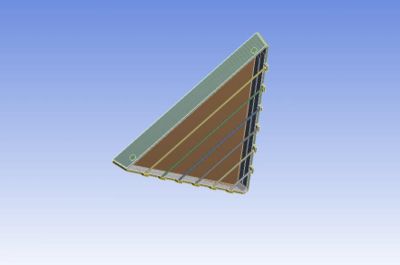
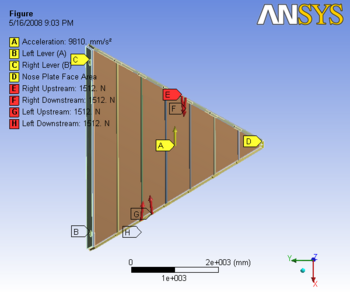
Figure 2: Images of Deflection for Sector 1 with hinges to the upstream side in D,X,Y,Z Directions respectively