Collimator parameters: in upstream side of wall 5/8 [math]\rightarrow[/math] 3/4", in downstream side of wall 1/2".
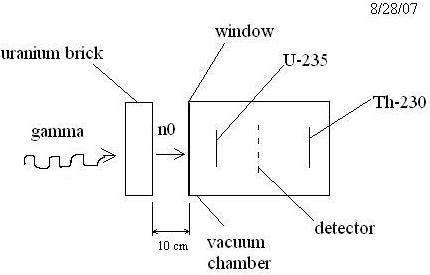
Figure 1: 8:21 am - [math]40 mAmps[/math] pulse, 200 ns, 300 Hz, [math]10^3 secs[/math] of beam, 6 fissions. 9:10 am - Threshold 80 mV, [math]N_{T1} = 17.6 counts/10 min[/math].
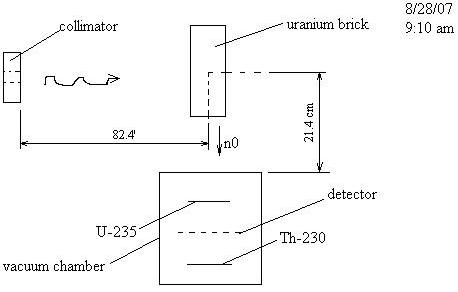
Figure 2: [math]\Delta T = 200 ns[/math], [math]I_e = 40 mA[/math], [math]f = 300 Hz[/math], [math]E_e = 20 MeV[/math], [math]q = 8.7 nC/pulse[/math]. [math]N_{T1} = 12 counts/10 min[/math], [math]N_{T2} = 35 counts/10 min[/math]
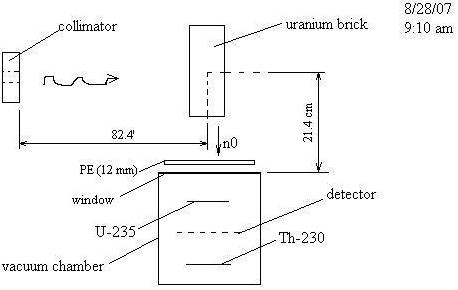
Figure 3: [math]\Delta T = 200 ns[/math], [math]I_e = 40 mA[/math], [math]f = 300 Hz[/math], [math]E_e = 20 MeV[/math], [math]q = 8.7 nC/pulse[/math]. [math]N_{T2} = 46 counts/10 min[/math], threshold = 80 mV, [math]P_B = 33.9[/math]
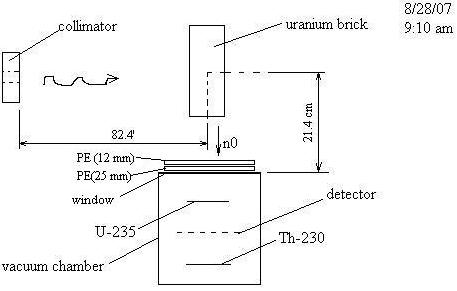
Figure 4: [math]\Delta T = 200 ns[/math], [math]I_e = 40 mA[/math], [math]f = 300 Hz[/math], [math]E_e = 20 MeV[/math], [math]q = 8.7 nC/pulse[/math]. [math]N_{T2} \sim 48 counts/10 min[/math], [math]N_{T1} (thresh = 30 mV, beam on) = 1065 counts/10 min[/math], threshold = 80 mV, [math]P_B = 33.9[/math]
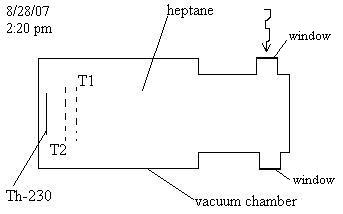
Figure 4: This new architecture is used for obtaining timing spectra during runs 60 - 63 (http://www.iac.isu.edu/mediawiki/index.php/Timing_spectra), [math]P_B = 3.97 Torr[/math], [math]P_C = 4.5 Torr[/math].
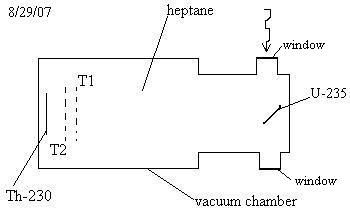
Figure 5: Beam produces nuclear fragments on [math]C^{12}[/math] and Al and fission fragments on [math]U^{235}[/math]. P = 4.96 Torr (heptane), [math]N_{T1} \sim 4.6/100 sec[/math] (beam off), [math]N_{T1} \sim 2.75/100 sec[/math] (beam on!). Chambers are not stable due to vacuum leak.
If nothing was changed this geometry was used to get all the energy spectra (http://www.iac.isu.edu/mediawiki/index.php/Energy_spectra_%28fiss_frag%29)
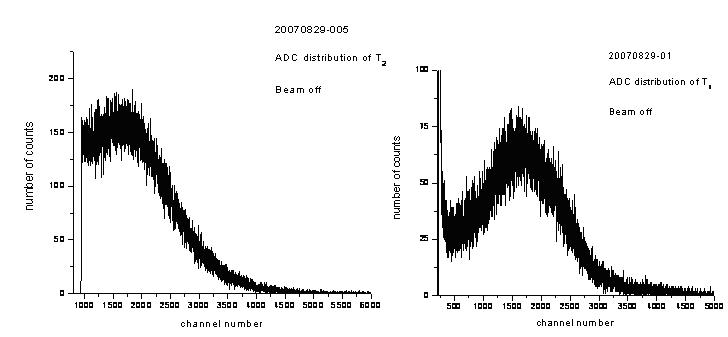
Figure 6: ADC distributions of [math]T_2[/math] (left) and [math]T_1[/math] (right). Data obtained via experimental setup shown in Figure 5.


