Single neutron angular distribution
The data on the single neutron angular distribution were extracted from the experimental data. All production runs with DU target were processed.
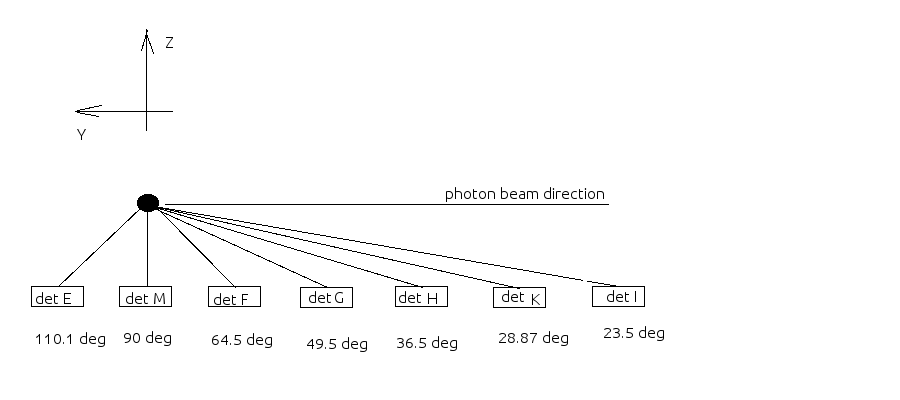
It was observed the angle between single neutron trajectory hitting the detector surface in different x-coordinates and incident photon direction for each of the plastic paddle detectors. This geometry is presented below:
Below each detector there is calculated (using the geometry) value of the angle between the photon beam and the neutron central trajectory hitting the detector.
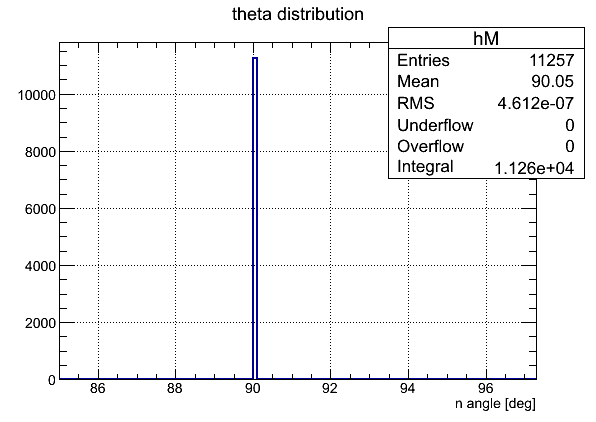
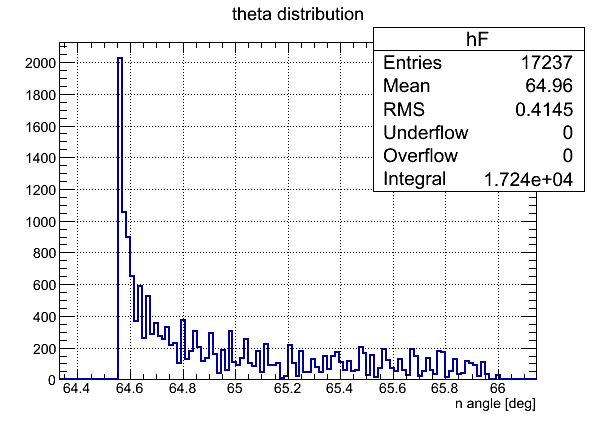
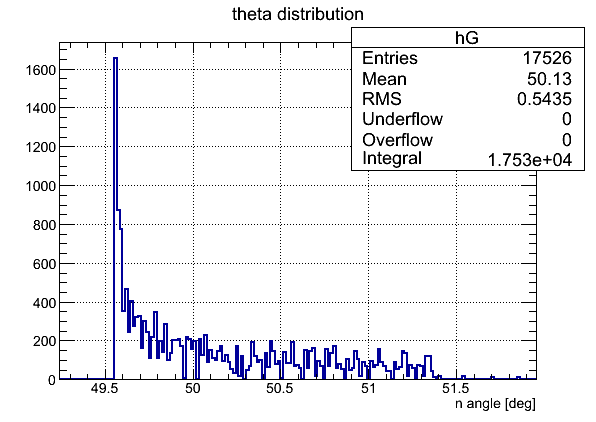
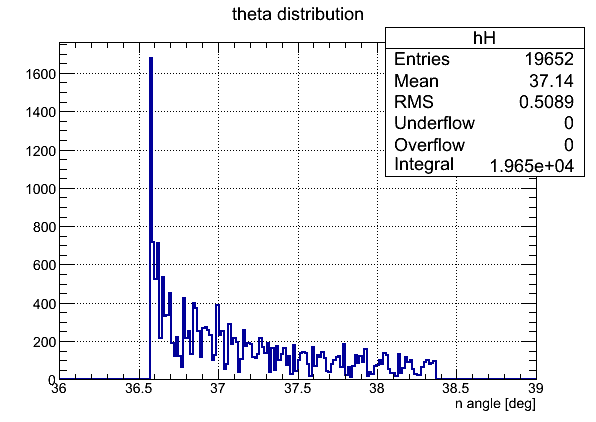
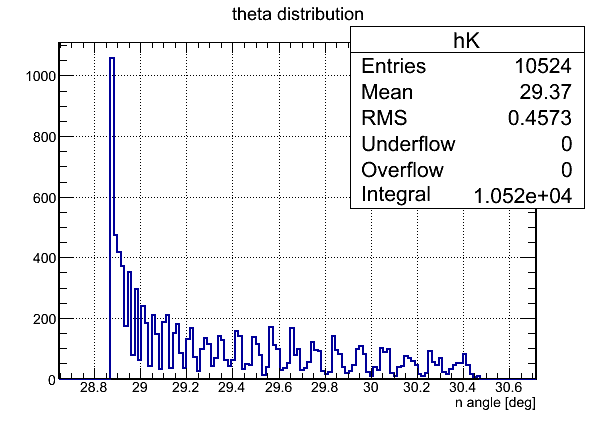
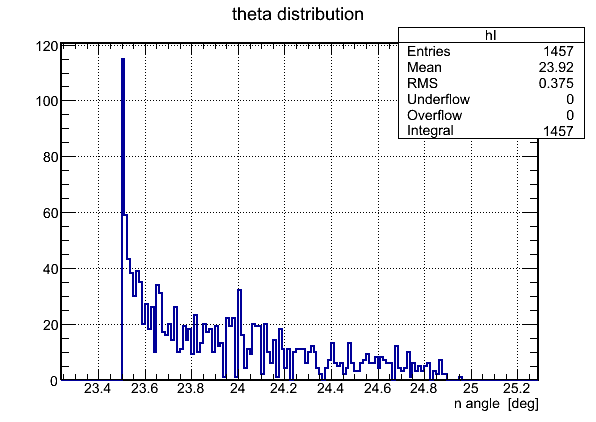
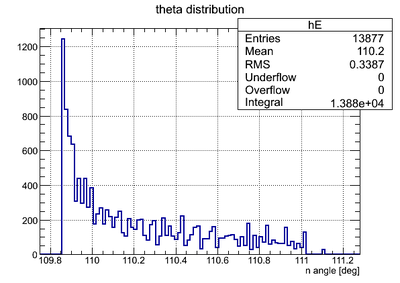
The single neutron angular distribution for each detector extracted from the experimental data is presented below.
Detector E:
| Experiment | Simulation |
|---|---|
|
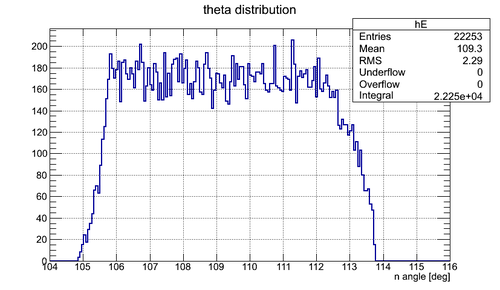
|
| Experiment | Simulation Solid angle = 0.093 sr |
Detector M:
Detector F:
Detector G:
Detector H:
Detector K:
Detector I:
As can be seen there is no overlap in the single neutron angular distributions for the neutron detectors.
