Settings
Tune by Brian
| Energy Switch |
Out (High En)
|
| Solenoid 1 top |
16.2 A
|
| Solenoid 2 bottom |
6.5 A
|
| Gun Hor |
-0 A
|
| Gun Ver |
-0.6 A
|
| Output Hor |
-0.3 A
|
| Output Ver |
+0.2 A
|
| Rep Rate |
200 Hz
|
| Gun HV |
10 (Knob Setting)
|
| Gun Grid Voltage |
9.8 (Knob Setting)
|
| RF frequency |
2855.866 MHz
|
| Modulator HV Power Supply |
4.69 (Knob Setting)
|
| RF macro Pulse Length (FWHM) |
90 ns
|
| Q1 (A) |
-0.5
|
| Q2 (A) |
-0.8
|
| Q3 (A) |
-0.2
|
| Q4 (A) |
+5.0
|
| Q5 (A) |
+1.0
|
| Q6 (A) |
-4.0
|
| Q7 (A) |
-9.0
|
| D8 (A) |
off
|
| D9 (A) |
22.3
|
| Q10 (A) |
-2.5
|
| Q11 (A) |
3.0
|
| Jaw width |
0.76
|
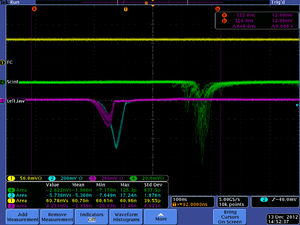
| Scope Image |

|
Energy Scan
Jaws at 0.5 cm.
D1 (A) Image
Emittance Measurement
| Energy Switch |
Out (High En)
|
| Solenoid 1 top |
16.2 A
|
| Solenoid 2 bottom |
6.5 A
|
| Gun Hor |
-0.5 A
|
| Gun Ver |
-0.3 A
|
| Output Hor |
+6.9 A
|
| Output Ver |
+7.1 A
|
| Rep Rate |
10 Hz
|
| Gun HV |
10 (Knob Setting)
|
| Gun Grid Voltage |
9.8 (Knob Setting)
|
| RF frequency |
2856.097 MHz
|
| Modulator HV Power Supply |
4.84 (Knob Setting)
|
| RF macro Pulse Length (FWHM) |
300 ns
|
| Q1 (A) |
0
|
| Q2 (A) |
0
|
| Q3 (A) |
0
|
| Q4 (A) |
0
|
| Q5 (A) |
0
|
| Q6 (A) |
0
|
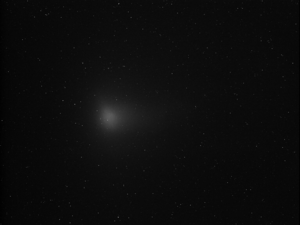
| Beam Image on 0 deg OTR |

|
Beam Spot out of 90 degree window
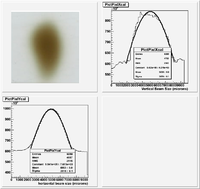
The image below was taken by irradiating a glass slide placed against the 90 degree exit port for 10 minutes. The slide was scanned in and ROOT was used to plot the image. The image was inverted so the low intensity (dark) parts of the image would have larger amplitude pixels than the higher intensity (bright) parts of the image. The beam position appears to have a gaussian like distribution with sigma of 2.6 mm in the horizontal plane and a sigma of 3.8 mm in the vertical plane.

File:12-12-2012BeamSpotRootAnalysisCode.txt


