Yields and Asymmetry for different detectors configurations.
Jump to navigation
Jump to search
Follow are some Monte Carlo simulations of 2n correlations. One neutron are from one FF, two neutrons per fission. No accidental neutron was considered, all neutrons are correlated. Total 10M events was simulated. Every neutron was sampled up to 10 MeV. The polarization of gammas are zero.
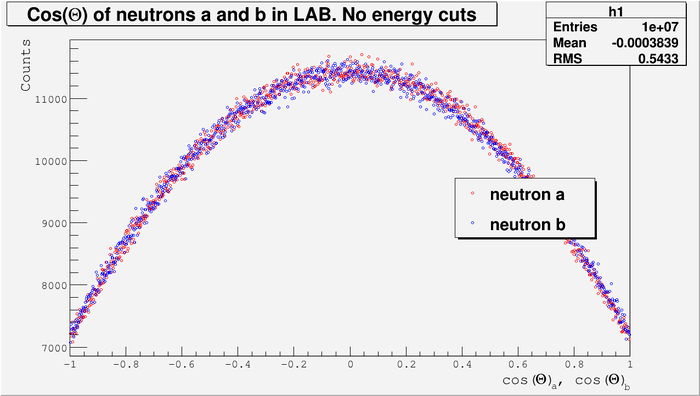
Below is cos(Theta) of neutrons a and b in LAB frame. No energy cuts was made.
The spectrum is a convolution of the "initial" spectrum which the FF emits, and the kinematic effects due to the fragment recoil
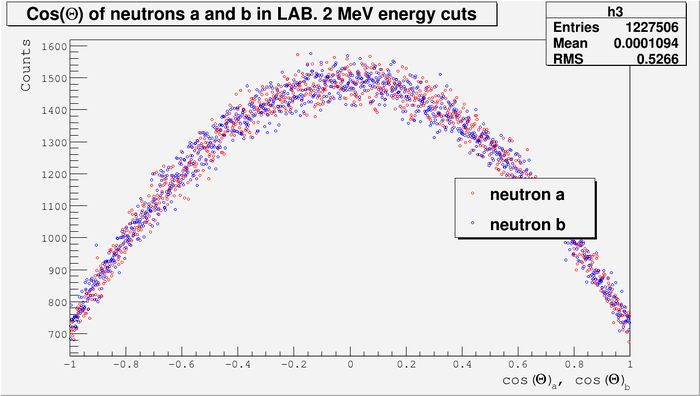
Below is the same spectrum, but made with 2 MeV energy cuts.
Let see some results of 2n simulations with different cuts.
In the table above are:
- cut1: 2 Mev energy cuts
- cut2: 2 Mev energy cuts. Plus angle cuts for each neutrons . That is detectors located in the plane perpendicular to the beam
- cut3: 2 Mev energy cuts. Plus angle cuts for each neutrons . That is detectors located in the plane parallel to the beam
- The best case is of cause geometry, when we collect all angle statistics. The 2n correlation yield is about 2.13 % with 2 MeV energy cuts
- The next good case is detectors located in the plane perpendicular to the beam. The 2n correlation yield is about 0.92 % with 2 MeV energy cuts
- The worst case is detectors located in the plane parallel to the beam. The 2n correlation yield is about 0.05 % with 2 MeV energy cuts


