HRRL 03-17-2011
Accelerator Tuning
Good Tune Used for good Scan
By Dr. Kim
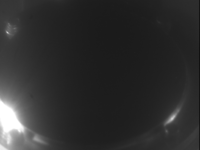
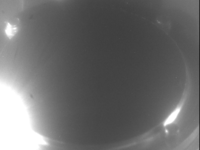
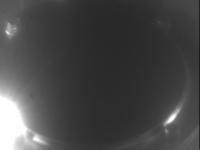
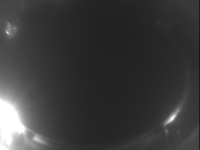
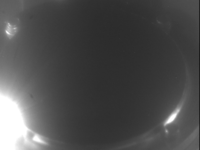
Calibration
| image | OTR image | cal_h (mm/px) | cal_v (mm/px) |
 |
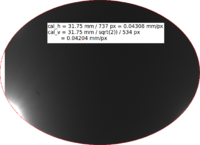 |
0.04308 | 0.04204 |
 |
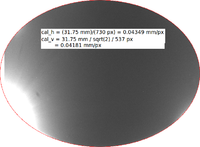 |
0.04320 | 0.04228 |
 |
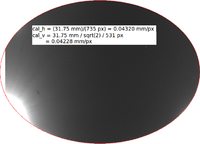 |
0.04349 | 0.04181 |
 |
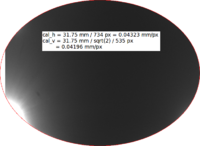 |
0.04323 | 0.04196 |
 |
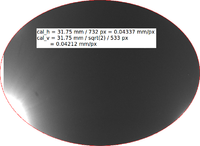 |
0.04337 | 0.04212 |
| mean (mm/px) | mean (mm/px) | ||
Results
Q1
At lower current background subtraction gets worse, because singal/noise drops.
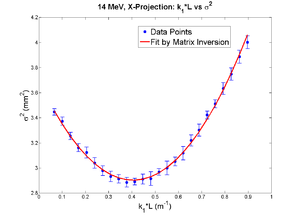
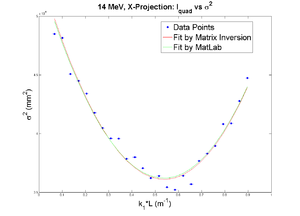
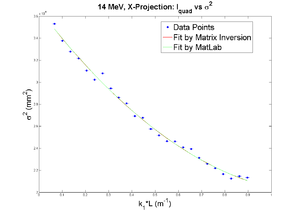
42 mA, Positive Current, X projection
emit=0.388 +- 0.008 mm*mrad, emit_norm=10.64 +- 0.22 mm*mrad
beta=1.285 +- 0.024, alpha=0.94 +-0.03
//K1*L(1/m) er K1*L sgima^2(mm) er sigma^2
Media:2011_Mar_Emit_fit_data_x.txt
parabola fit for x-projection:
In m unit
y = 3.69167*10^(-6) -3.89000*x*10^(-6) + 4.79738*x.*x*10^(-6)
In mm unit
y = 3.69167 -3.89000*x + 4.79738*x.*x
Data created from parabola fit
Media:2011_Mar_Emit_data_from_fit_x.txt
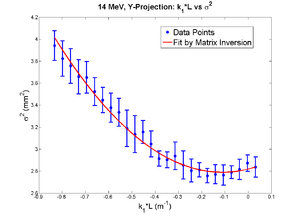
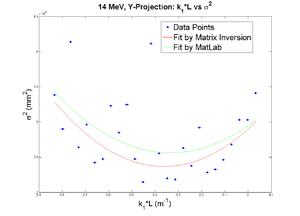
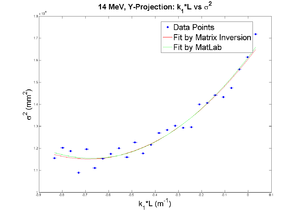
42 mA, Negative Current, Y projection
emit=0.266 +- 0.018 mm*mrad, emit_norm=7.30 +- 0.50 mm*mrad
beta=0.918 +- 0.068, alpha=0.19 +-0.06
//K1*L(1/m) er K1*L sgima^2(mm) er sigma^2
Media:2011_Mar_Emit_fit_data_y.txt
parabola fit for y-projection:
In m unit:
y = 2.81806*10^(-6) + 0.52202*x*10^(-6) + 2.35025*x.*x*10^(-6)
In mm unit:
y = 2.81806 + 0.52202*x + 2.35025*x.*x
Data created from parabola fit
Media:2011_Mar_Emit_data_from_fit_y.txt
X and Y emittances are different. The parabola in X reaches min around 0.4, while in Y reaches around 0.15. Which suggests quadrupole strengths of X and Y are way different for same coil current. Which might suggest beam is not centered, because when beam is off-centered we have this can occur.
20 mA, Positive Current, X projection
10 mA, Positive Current, X projection
5 mA, Positive Current, X projection
Q4
42 mA All Other Quads off
Haven't reach minimum.
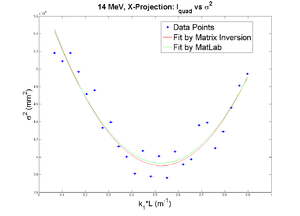
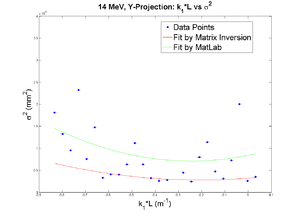
42 mA Q1_at_-2A, Q2_at_+8A, Q3_at_-6A
x-projection:
y-projection:

