October 22, 2008
Unpolarized Measurents:
A 2x4x8" aluminum brick was placed at the HRRL export in order to destroy the photon polarization. Rate measurements were made with the descriminator and HV settings used the past week. Then the constant fraction descriminator was replaced with a threshold descriminator on two detectors but not the reference detector.
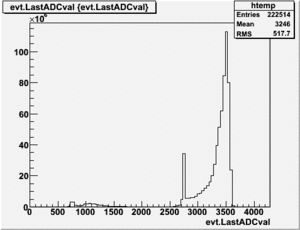
ADC =0 => Reference Detector D
ADC = 1 => NaI
ADC=2 => Detector C
ADC = 3 => Detector A
channel # * 0.1675 ns/chan => ns
Default HV and CF descriminator
Matched HV and Threshold Descriminator
2 Runs were taken with the following settings
100 ms Threshold descrimnaotr
=
=
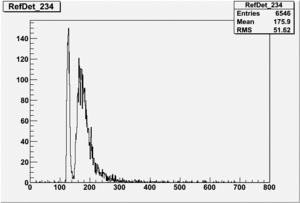
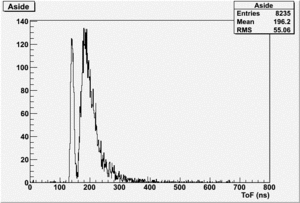
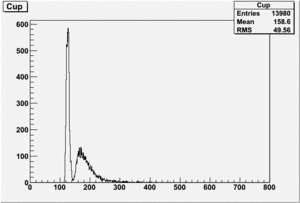
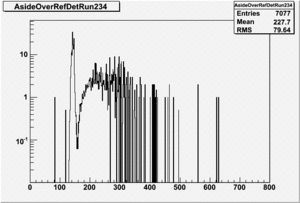
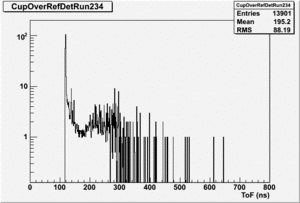
Run 234
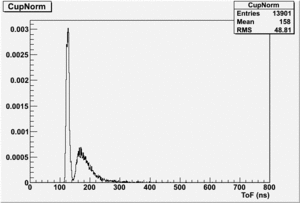
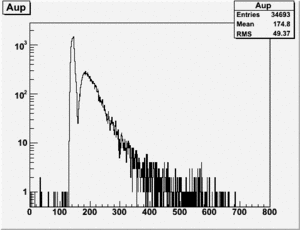
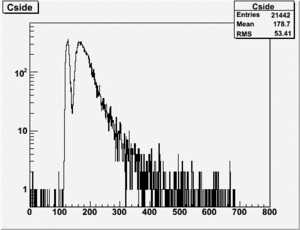
If I normalize using the Reference detector I see
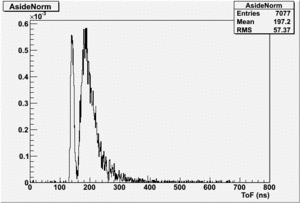
If I normalize using the NaI detector I see:
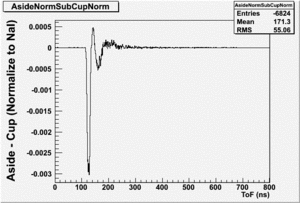
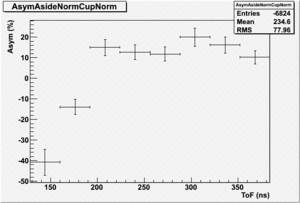
The Difference and Asymmetry measurements.
The above is just an example of how to analyze the data. Students should take my bad example and improve upon it.
The program I used to generate the above pictures from a ROOT file is given below.
I used the "PhotoFis->MakeClass()" command within root to generate the skeleton program which has 2 files called Media:PhotoFis.h.txt and Media:PhotoFis.C.txt.
You define your histogram variables and the file you are opening to analyze in the file Media:PhotoFis.h.txt.
see the lines which look like
  TH1F *NaiInt229, *RefDetRun229, *Aup, *Cside, *Nai229, *Unity;
  TH1F *NaiInt234, *RefDetRun234, *Aside, *Cup, *Nai234;
  TH1F *AsideOverRefDetRun234, *CupOverRefDet234, , *AupOverRefDet229, *CsideOverRefDet229;
  TH1F *AsideNormSubCupNorm, *AsideNormAddCupNorm, *AsymAsideNormCupNorm;
     TFile *f = (TFile*)gROOT->GetListOfFiles()->FindObject("DetCup_10_10_08_00234.root");
     if (!f) {
        f = new TFile("DetCup_10_10_08_00234.root");
You create your histograms, loop over the ntuple entries , and perform histogram operations in the file Media:PhotoFis.C.txt
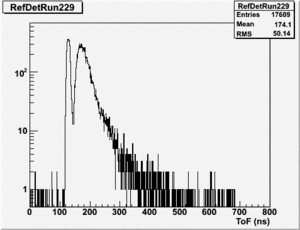
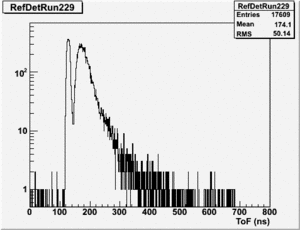
Run 229
The root commands
root [24] TH1F *RefDetRun229=new TH1F("RefDetRun229","RefDetRun229",800,0,800);
root [25] PhotoFis->Draw("evt.ADCval*0.1675 >> RefDetRun229","evt.ADCnum==0 && evt.LastADCval>0");
Will create histogram with 800 channels and 800 bins so we have 1 bin per channel (ns).
To normalize the data you need to integrate the NaI histogram. To do this a skeleton program is creates using ROOT which will loop through the ROOT ntuple using the command
PhotoFis->MakeClass();
You will see a file called PhotoFis.C after you execute the above command within the ROOT interpreter window.
Asym
Now do Asym plots using the same detector normalize by the Reference detector in one case and the NaI detector in another.
H20 runs
run 140
Det A on top
uses file 199.lst
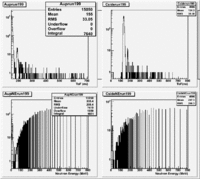
The spectrum below shows the Time of Flight spectrum for Detectors "A" and "C". The bottom figures represent the energy calculated from the time of flight when a neutron is assumed as the detected particle. Events beyond 50 MeV are from the photon peak. In order to determine the time of flight the average ToF for a photon (140 ns) was used as the start time. Photon events above this average will appear at energies beyond 50 MeV and photon events below this average will have negative times and appear as Underflows in histogram AupNErun199. There are 7640 events in Histogram Auprun199 above 146 ns correspond to the (15050-7410=7640) events shown in AupNErun199 histogram.
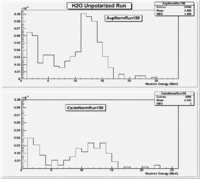
Neutrons from the target should have energies below 14 MeV. The spectrum below were normalized by the number of NaI events observed during the run.
run 136
Det A on side
uses file 194.lst
http://www.iac.isu.edu/mediawiki/index.php/October_Fission_HRRL_Measurements_2008 go back
